haven

Rで学ぶ中級データインポート

Filip Schouwenaars

Instructor, DataCamp

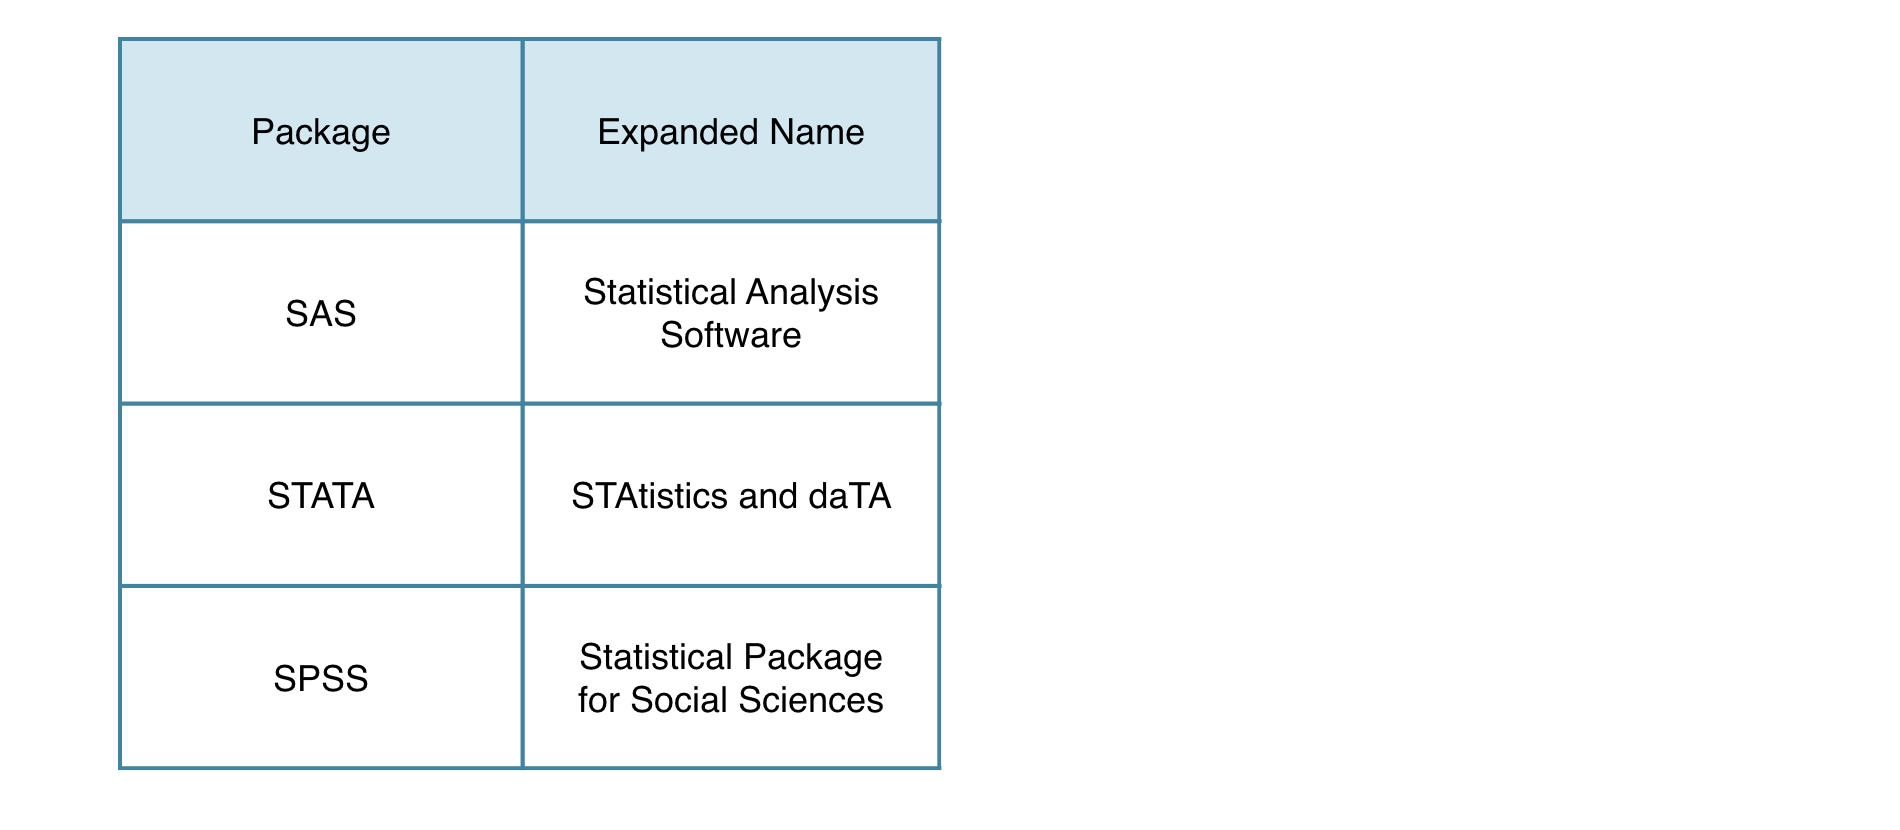
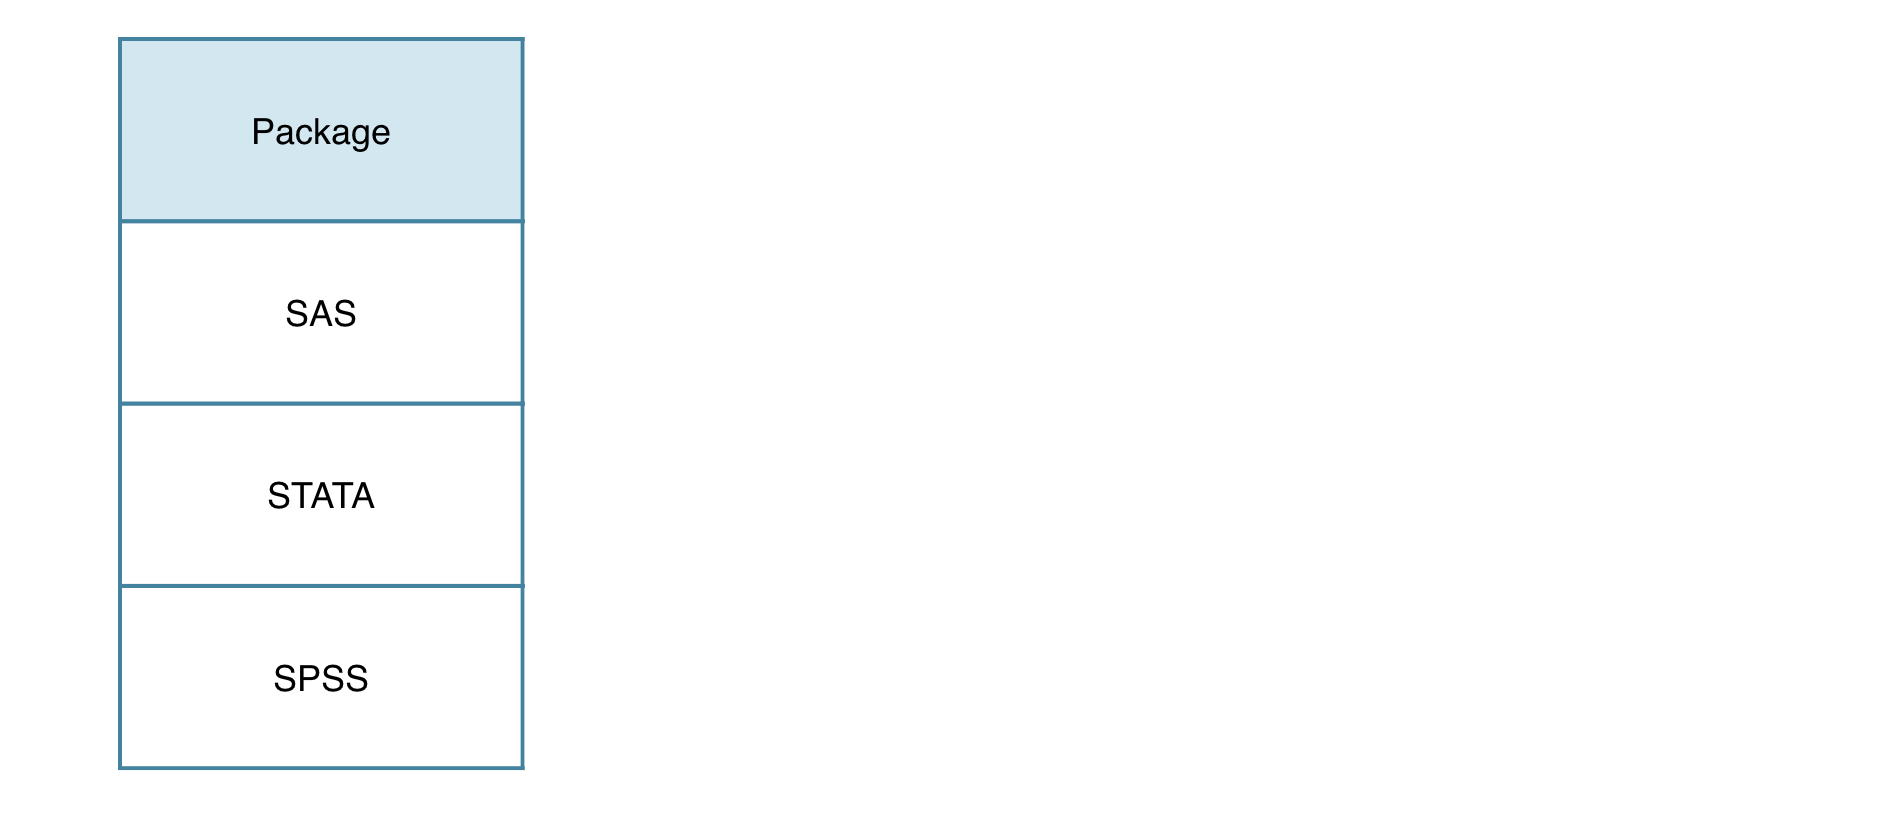
統計ソフトウェア
ch_5_1_slides.003.png

Rで学ぶ中級データインポート

統計ソフトウェア

ch_5_1_slides.004.png

Rで学ぶ中級データインポート

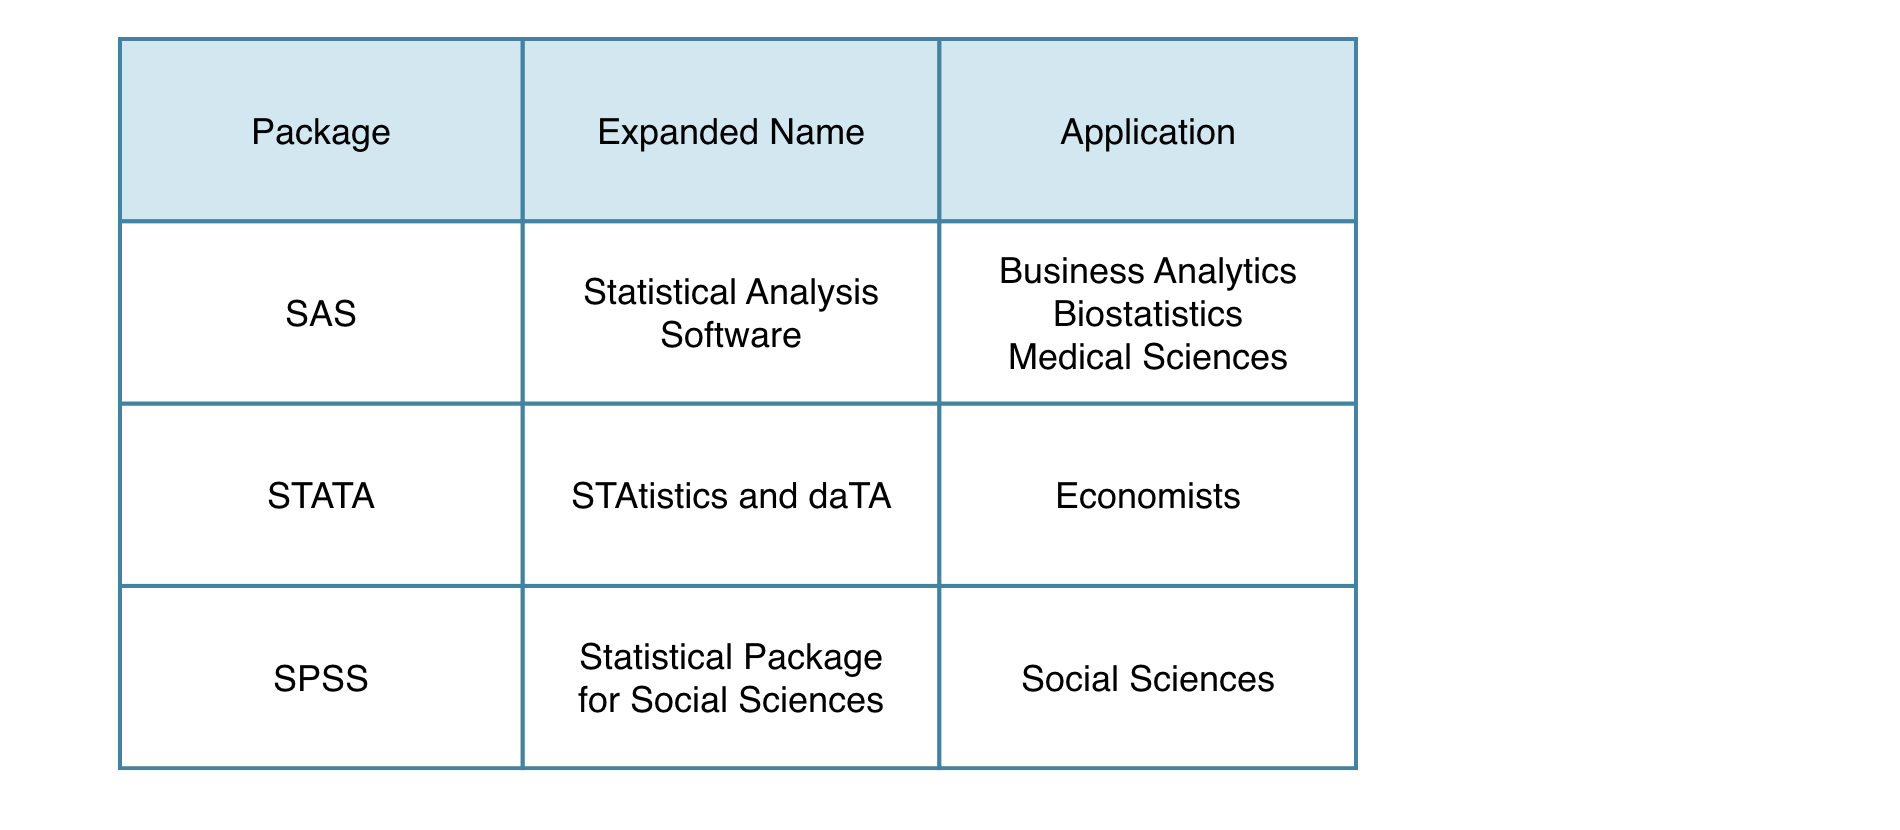
統計ソフトウェア

ch_5_1_slides.005.png

Rで学ぶ中級データインポート

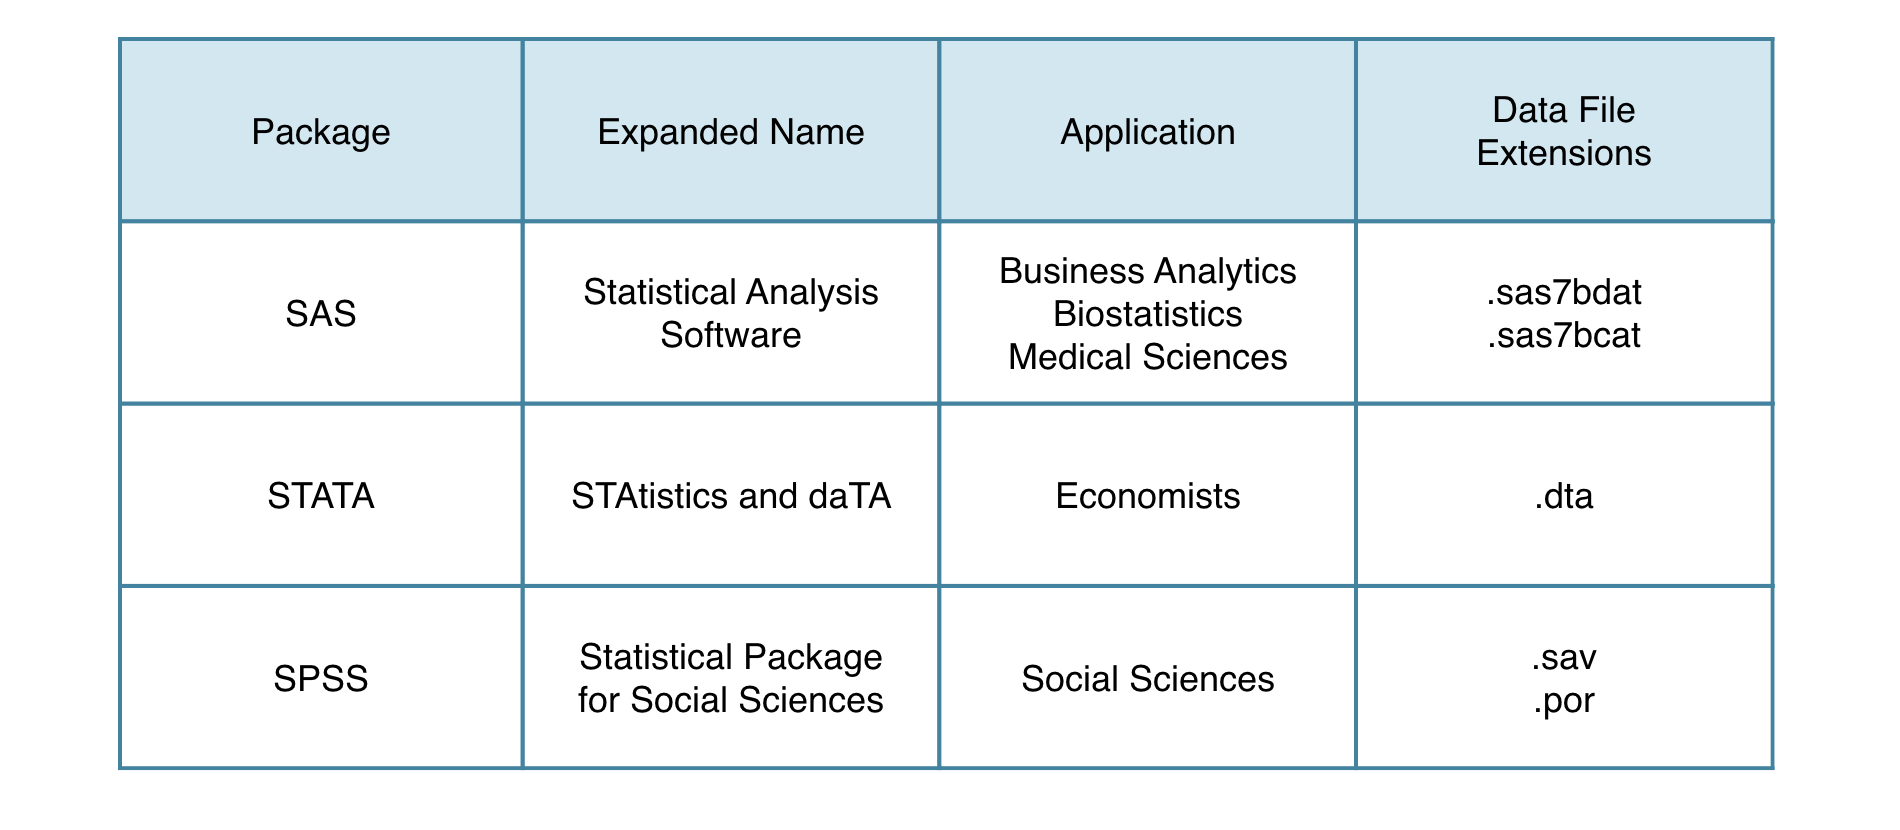
統計ソフトウェア

ch_5_1_slides.006.png

Rで学ぶ中級データインポート

データ取込用 R パッケージ

  • haven

    • Hadley Wickham

    • 目標:一貫性・簡便・高速

  • foreign

    • R コアチーム

    • 多くのデータ形式をサポート

Rで学ぶ中級データインポート

haven

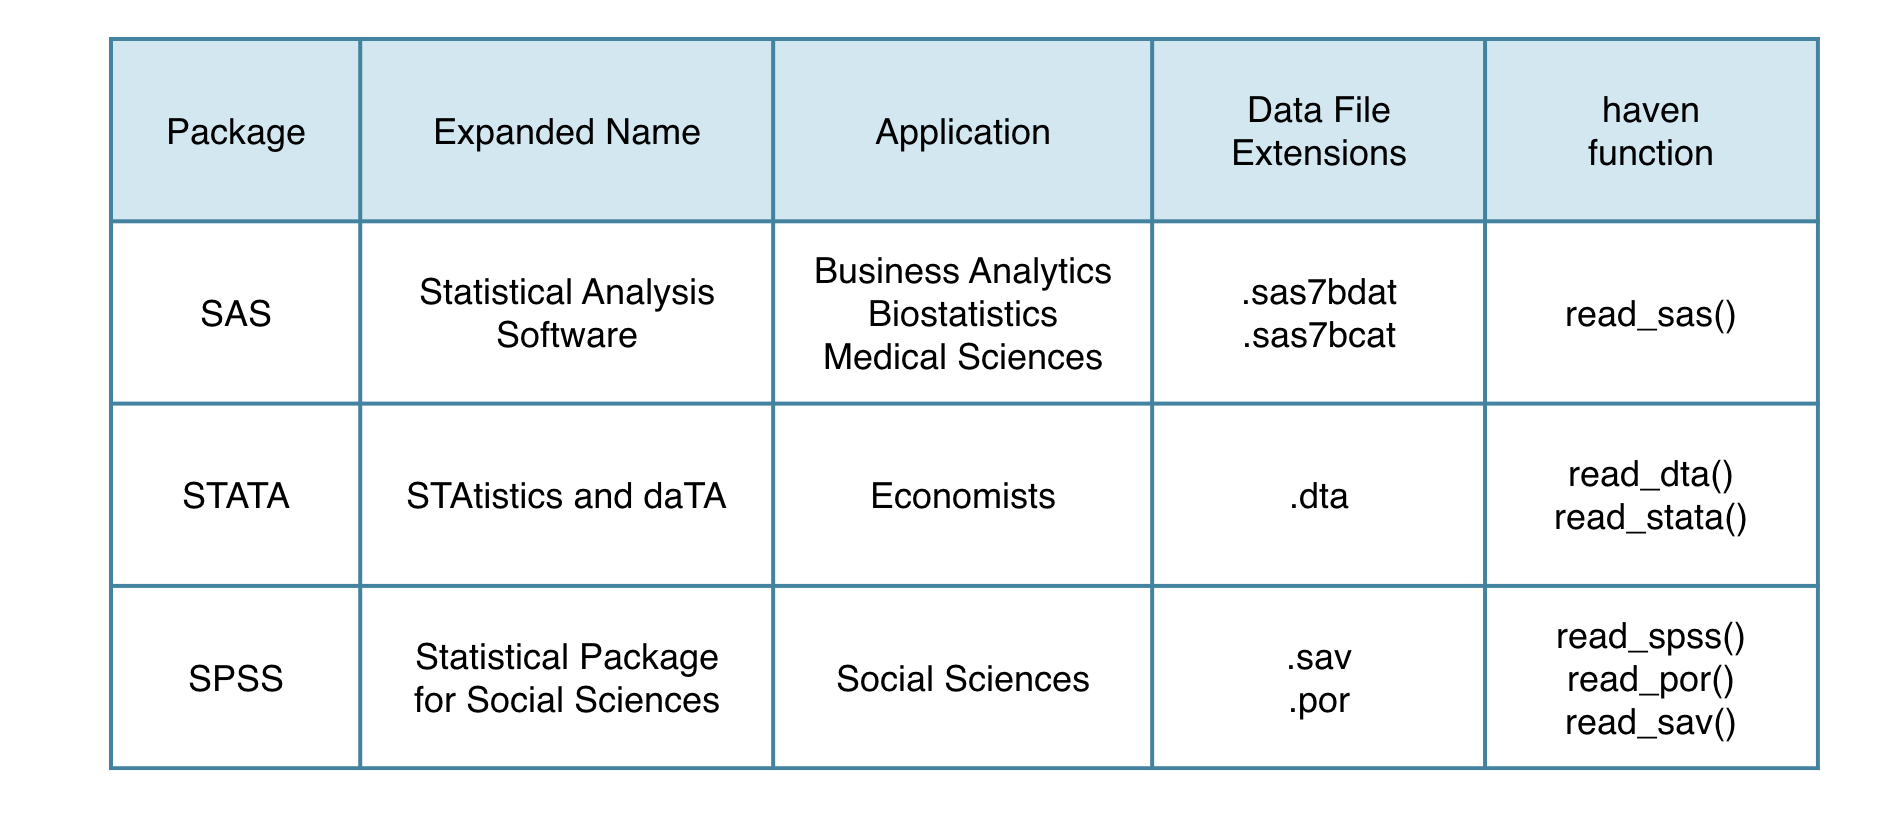
  • SAS、STATA、SPSS

  • ReadStat:Evan Miller による C ライブラリ

  • 使い方は非常に簡単

  • 引数はファイルパスのみ

  • 結果:R のデータフレーム

install.packages("haven")
library(haven)
Rで学ぶ中級データインポート

SAS データ

  • ontime.sas7bdat

    • 米国航空会社の遅延統計
  • read_sas()

ontime <- read_sas("ontime.sas7bdat")
Rで学ぶ中級データインポート

SAS データ

ontime <- read_sas("ontime.sas7bdat")
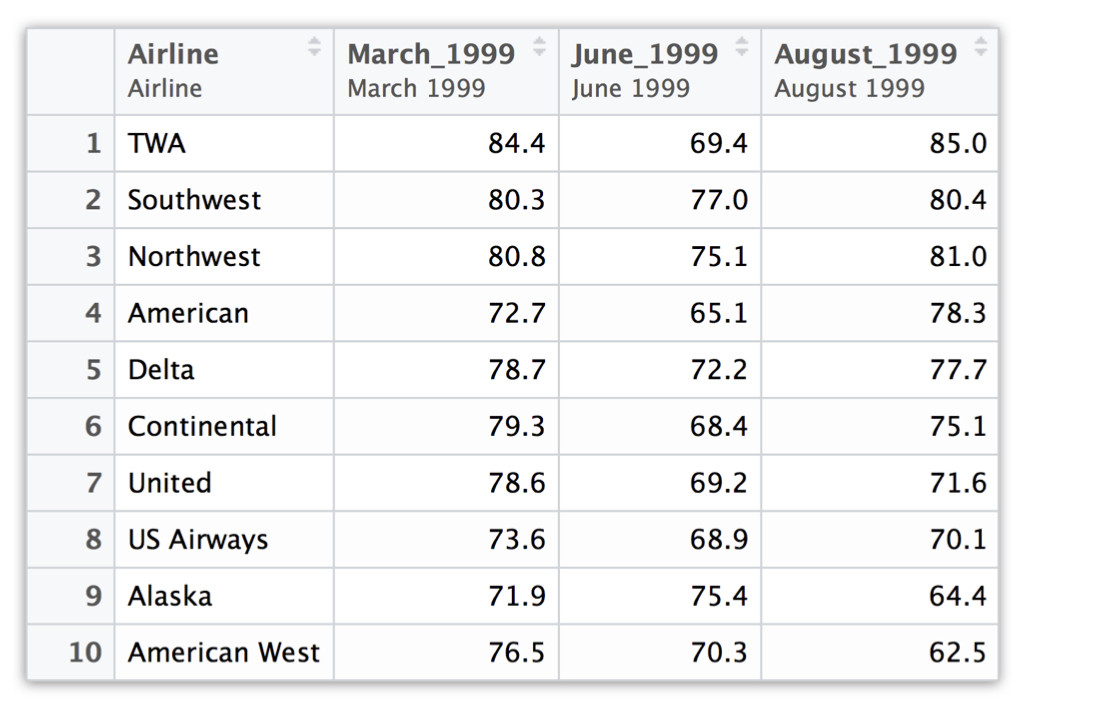
str(ontime)
Classes ‘tbl_df’, ‘tbl’ and 'data.frame':    10 obs. of  4 variables:
 $ Airline    : atomic  TWA Southwest Northwest ...
  ..- attr(*, "label")= chr "Airline"
 $ March_1999 : atomic  84.4 80.3 80.8 72.7 78.7 ...
  ..- attr(*, "label")= chr "March 1999"
 $ June_1999  : atomic  69.4 77 75.1 65.1 72.2 ...
  ..- attr(*, "label")= chr "June 1999"
 $ August_1999: atomic  85 80.4 81 78.3 77.7 75.1 ...
  ..- attr(*, "label")= chr "August 1999"
Rで学ぶ中級データインポート

SAS データ

ontime <- read_sas("ontime.sas7bdat")
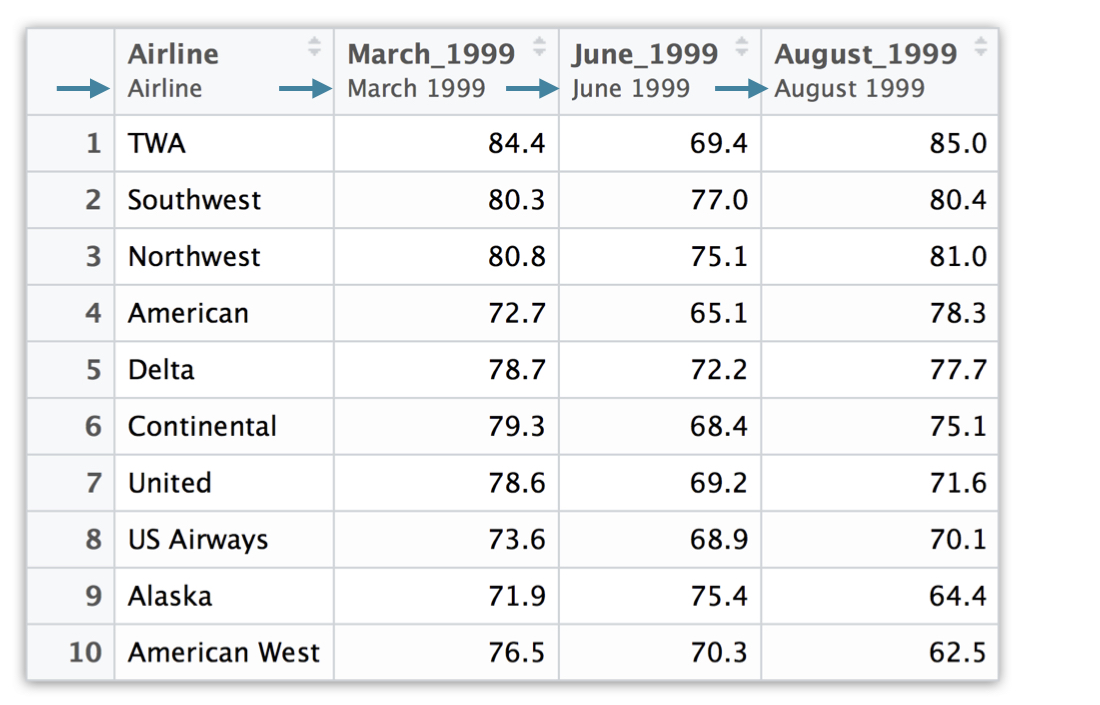
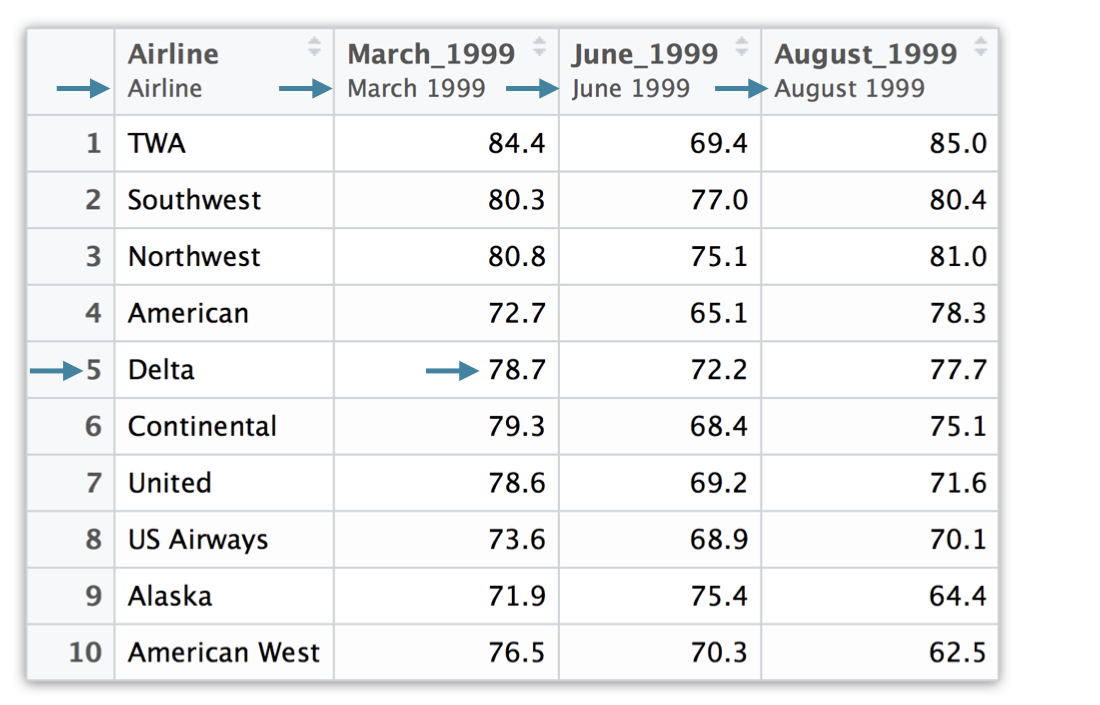
ontime
         Airline March_1999 June_1999 August_1999
1            TWA       84.4      69.4        85.0
2      Southwest       80.3      77.0        80.4
3      Northwest       80.8      75.1        81.0
4       American       72.7      65.1        78.3
5          Delta       78.7      72.2        77.7
6    Continental       79.3      68.4        75.1
7         United       78.6      69.2        71.6
8     US Airways       73.6      68.9        70.1
9         Alaska       71.9      75.4        64.4
10 American West       76.5      70.3        62.5
Rで学ぶ中級データインポート

SAS データ

ontime <- read_sas("ontime.sas7bdat")
ch_5_1_slides.037.png

Rで学ぶ中級データインポート

SAS データ

ontime <- read_sas("ontime.sas7bdat")

ch_5_1_slides.038.png

Rで学ぶ中級データインポート

SAS データ

ontime <- read_sas("ontime.sas7bdat")

ch_5_1_slides.039.png

Rで学ぶ中級データインポート

STATA データ

  • STATA 13STATA 14

  • read_stata()read_dta()

Rで学ぶ中級データインポート

STATA データ

ontime <- read_stata("ontime.dta")
ontime <- read_dta("ontime.dta")
ontime
   Airline March_1999 June_1999 August_1999
1        8       84.4      69.4        85.0
2        7       80.3      77.0        80.4
3        6       80.8      75.1        81.0
4        2       72.7      65.1        78.3
5        5       78.7      72.2        77.7
6        4       79.3      68.4        75.1
7        9       78.6      69.2        71.6
8       10       73.6      68.9        70.1
9        1       71.9      75.4        64.4
10       3       76.5      70.3        62.5
Rで学ぶ中級データインポート

STATA データ

ontime <- read_stata("ontime.dta")
ontime <- read_dta("ontime.dta")
# R version of common data structure
class(ontime$Airline)
"labelled"
ontime$Airline
<Labelled>
8  7  6  2  5  4  9 10  1  3
attr(,"label")
"Airline"
Labels:
       Alaska   American  American West  ...  US Airways 
            1          2              3  ...          10
Rで学ぶ中級データインポート

as_factor()

ontime <- read_stata("ontime.dta")
ontime <- read_dta("ontime.dta")
as_factor(ontime$Airline)
TWA    Southwest  Northwest   American ... American West
Levels: Alaska American American West ... US Airways
as.character(as_factor(ontime$Airline))
"TWA" "Southwest" "Northwest" ... "American West"
Rで学ぶ中級データインポート

as_factor()

ontime$Airline <- as.character(as_factor(ontime$Airline))
ontime
         Airline March_1999 June_1999 August_1999
1            TWA       84.4      69.4        85.0
2      Southwest       80.3      77.0        80.4
3      Northwest       80.8      75.1        81.0
4       American       72.7      65.1        78.3
5          Delta       78.7      72.2        77.7
6    Continental       79.3      68.4        75.1
7         United       78.6      69.2        71.6
8     US Airways       73.6      68.9        70.1
9         Alaska       71.9      75.4        64.4
10 American West       76.5      70.3        62.5
Rで学ぶ中級データインポート

SPSS データ

  • read_spss()

  • .por -> read_por()

  • .sav -> read_sav()

read_sav(file.path("~","datasets","ontime.sav"))
   Airline Mar.99 Jun.99 Aug.99
1        8   84.4   69.4   85.0
2        7   80.3   77.0   80.4
3        6   80.8   75.1   81.0
4        2   72.7   65.1   78.3
5        5   78.7   72.2   77.7
...
10       3   76.5   70.3   62.5
Rで学ぶ中級データインポート

統計ソフトウェア

ch_5_1_slides.001.png

Rで学ぶ中級データインポート

Ayo berlatih!

Rで学ぶ中級データインポート

Preparing Video For Download...