説明のためのモデリング問題

tidyverse で学ぶモデリング

Albert Y. Kim

Assistant Professor of Statistical and Data Sciences

復習:一般的なモデリングの枠組み

$$ y = f(\vec{x}) + \epsilon $$

各記号の意味:

  • $y$: 目的変数
  • $\vec{x}$: 説明変数/予測変数
  • $f()$: $y$ と $\vec{x}$ の関係を表す関数(シグナル
  • $\epsilon$: 非系統的な誤差成分(ノイズ
tidyverse で学ぶモデリング

モデリング問題

$y = f(\vec{x}) + \epsilon$ を考える。

  1. $f()$ と $\epsilon$ は未知である
  2. $y$ と $\vec{x}$ の $n$ 個の観測値はデータから既知
  3. 目標:$\epsilon$ を無視しつつ $f()$ を近似するモデル $\hat{f}()$ を適合させる
  4. 目標の言い換えシグナルとノイズを分離する
  5. 適合値/予測値 $\hat{y} = \hat{f}(\vec{x})$ を生成できる
tidyverse で学ぶモデリング

説明のためのモデリング例

tidyverse で学ぶモデリング

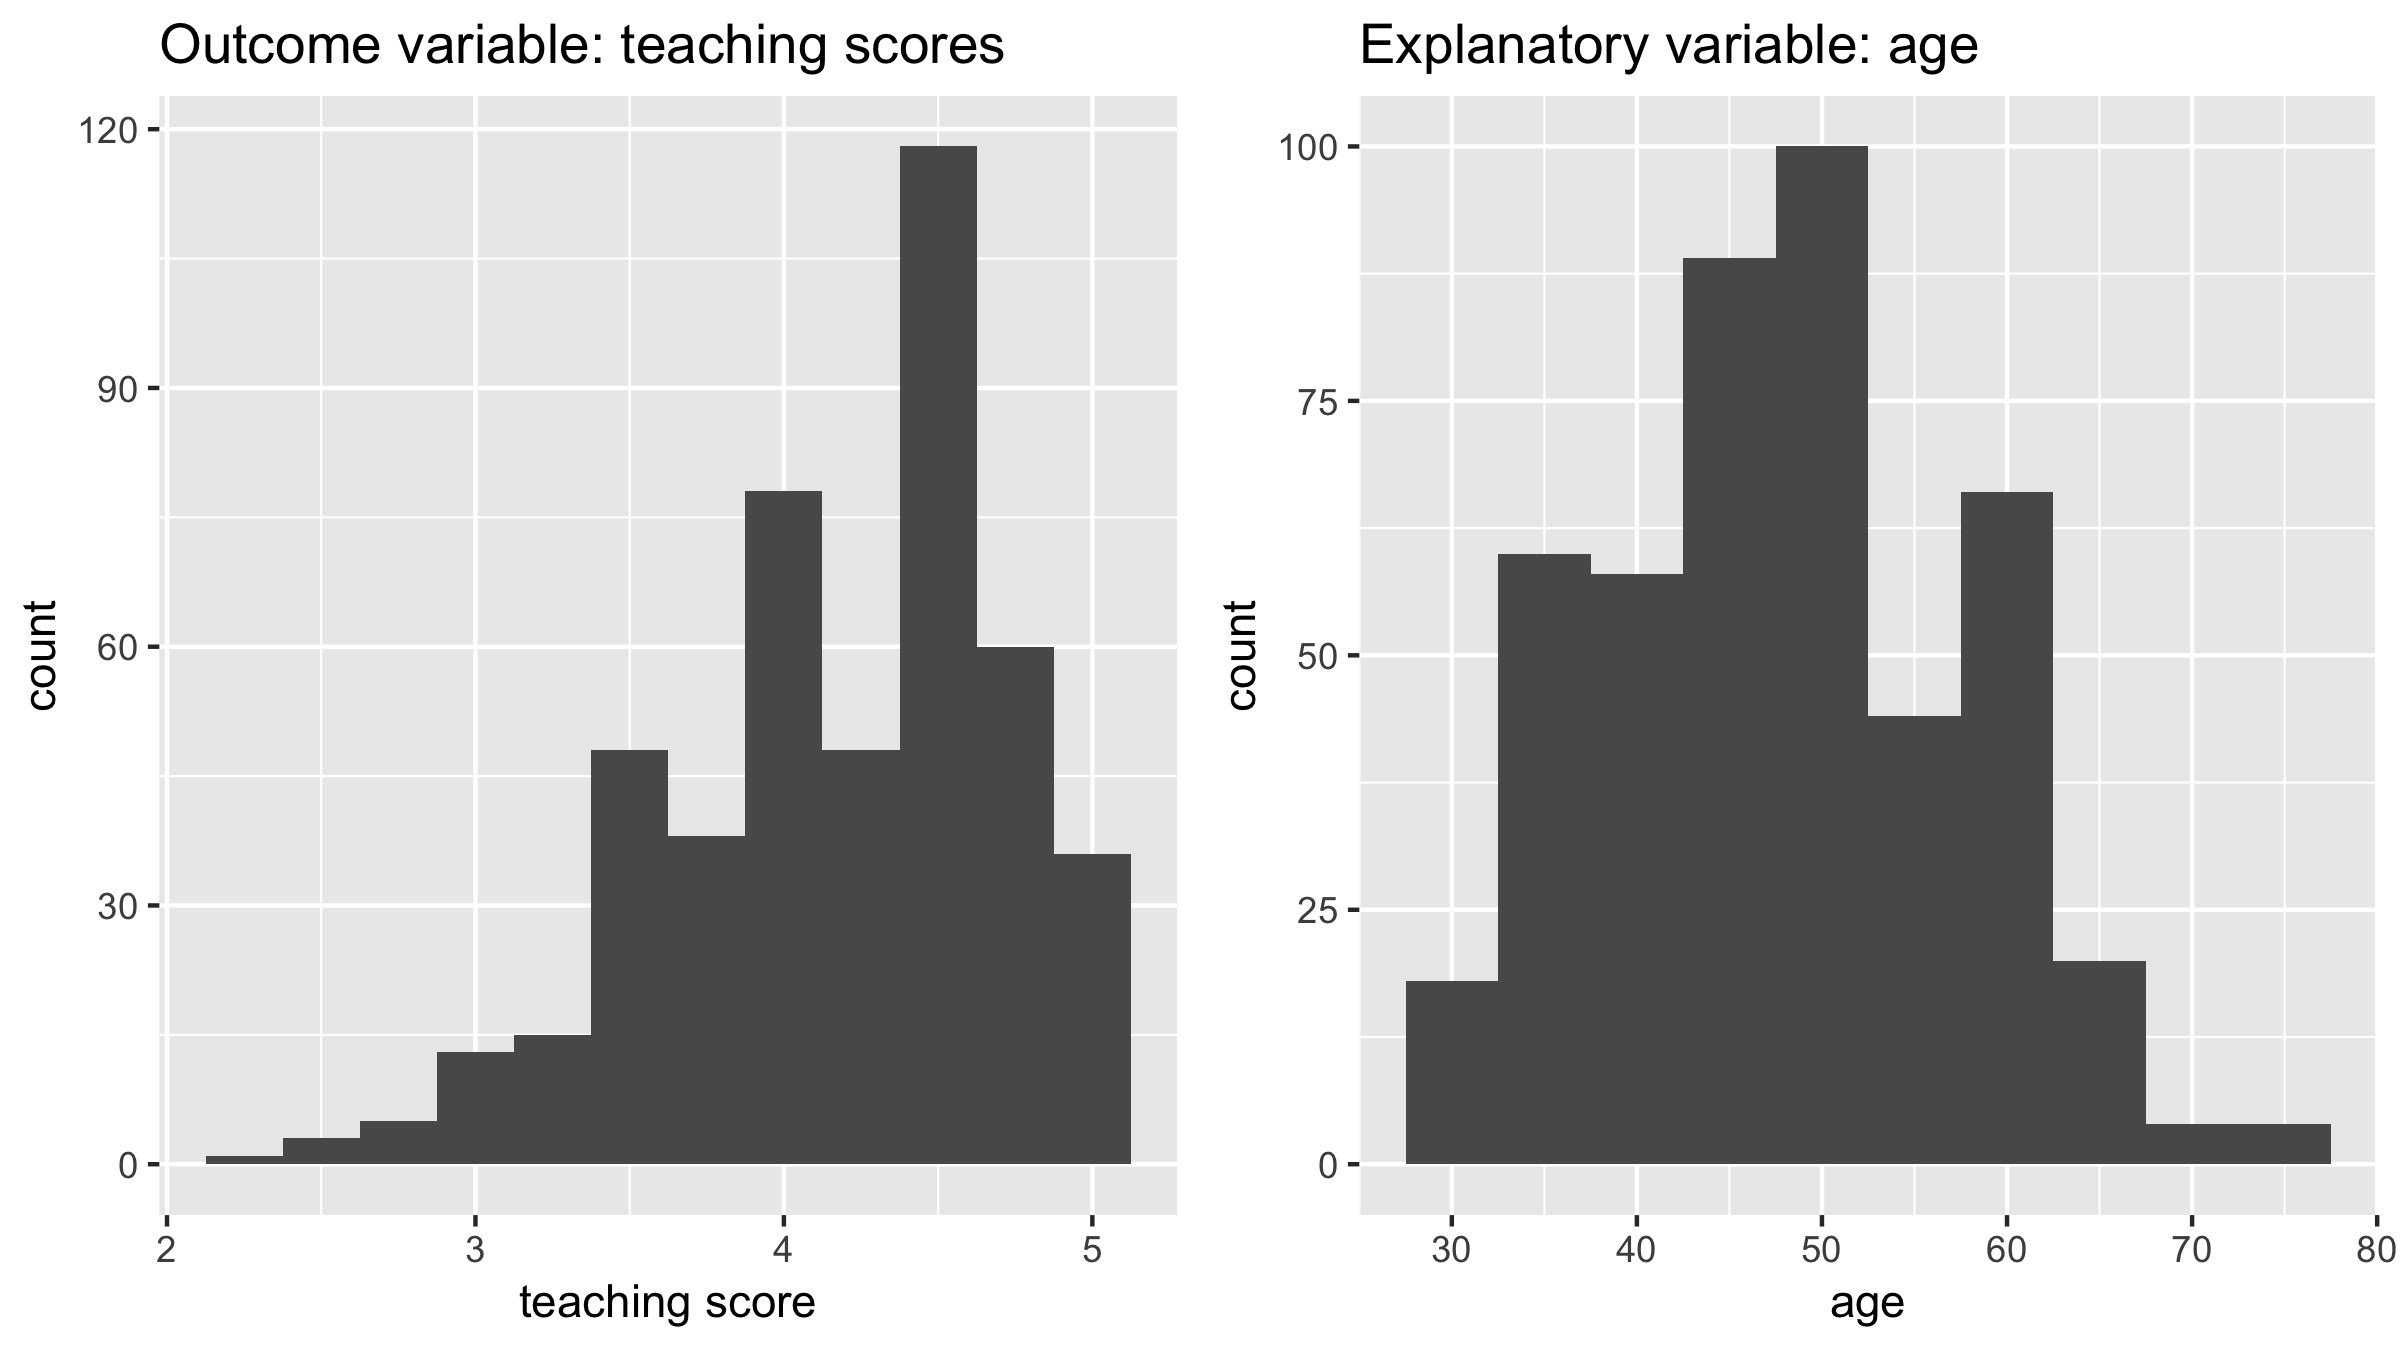
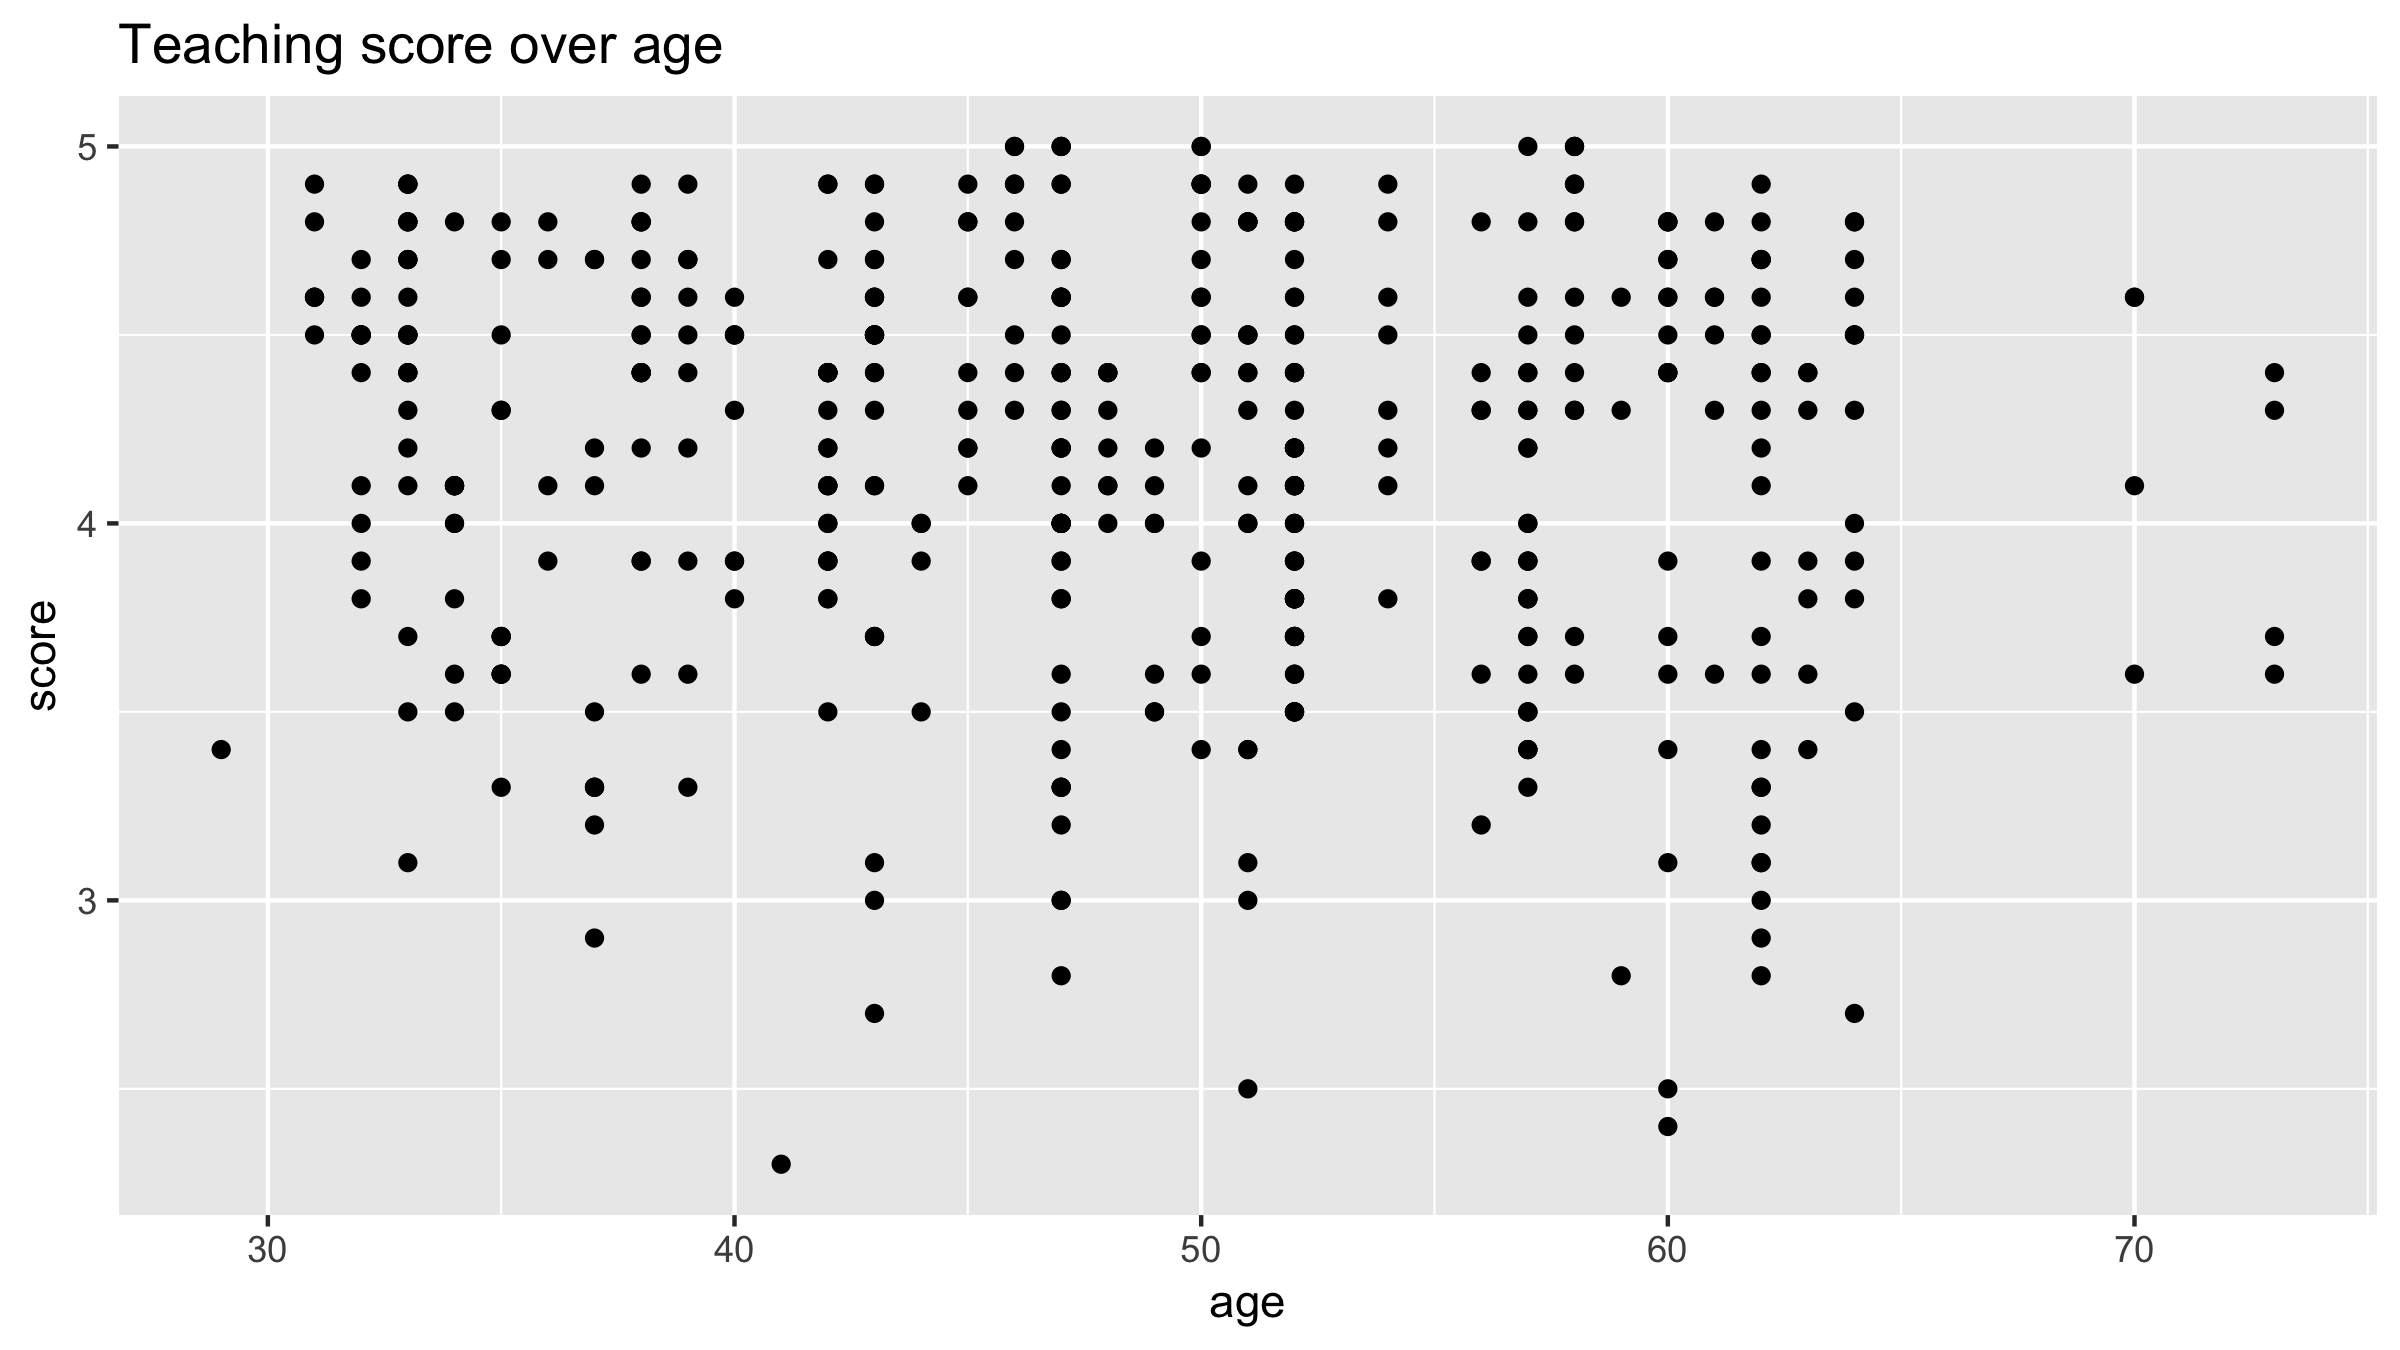
関係の探索的データ分析

library(ggplot2)
library(dplyr)
library(moderndive)

ggplot(evals, aes(x = age, y = score)) +
  geom_point() + 
  labs(x = "age", y = "score",
       title = "Teaching score over age")
tidyverse で学ぶモデリング

関係の探索的データ分析

tidyverse で学ぶモデリング

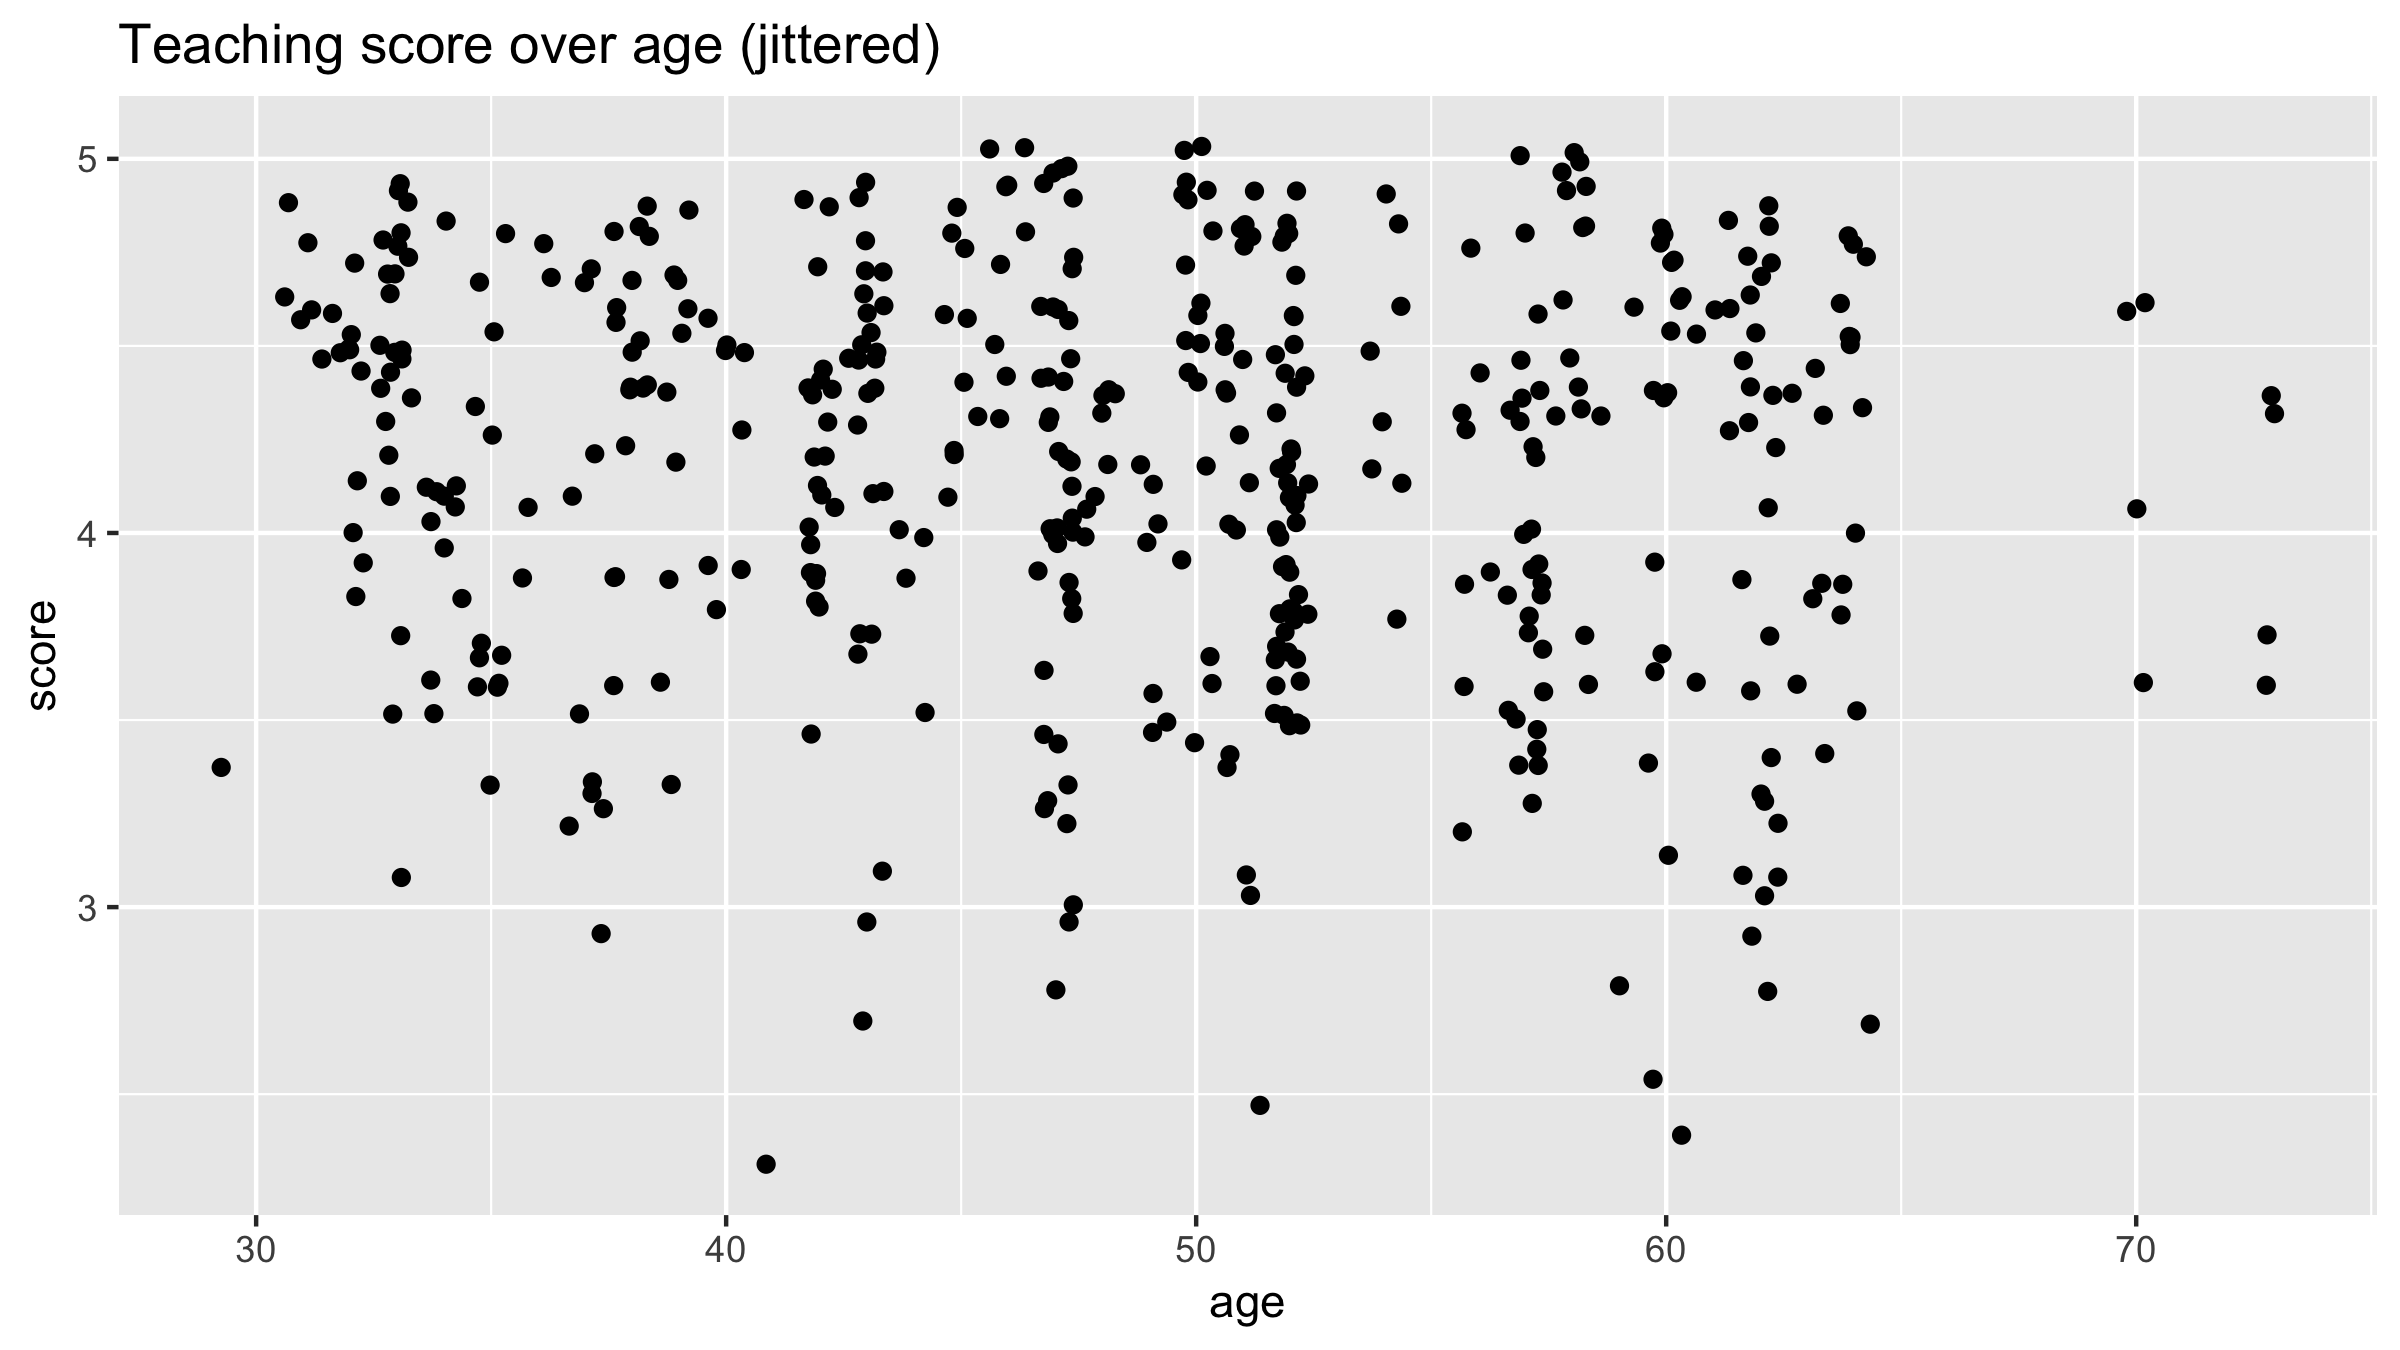
ジッタースキャッタープロット

library(ggplot2)
library(dplyr)
library(moderndive)

# Use geom_jitter() instead of geom_point()
ggplot(evals, aes(x = age, y = score)) +
  geom_jitter() + 
  labs(x = "age", y = "score",
       title = "Teaching score over age (jittered)")
tidyverse で学ぶモデリング

ジッタースキャッタープロット

tidyverse で学ぶモデリング

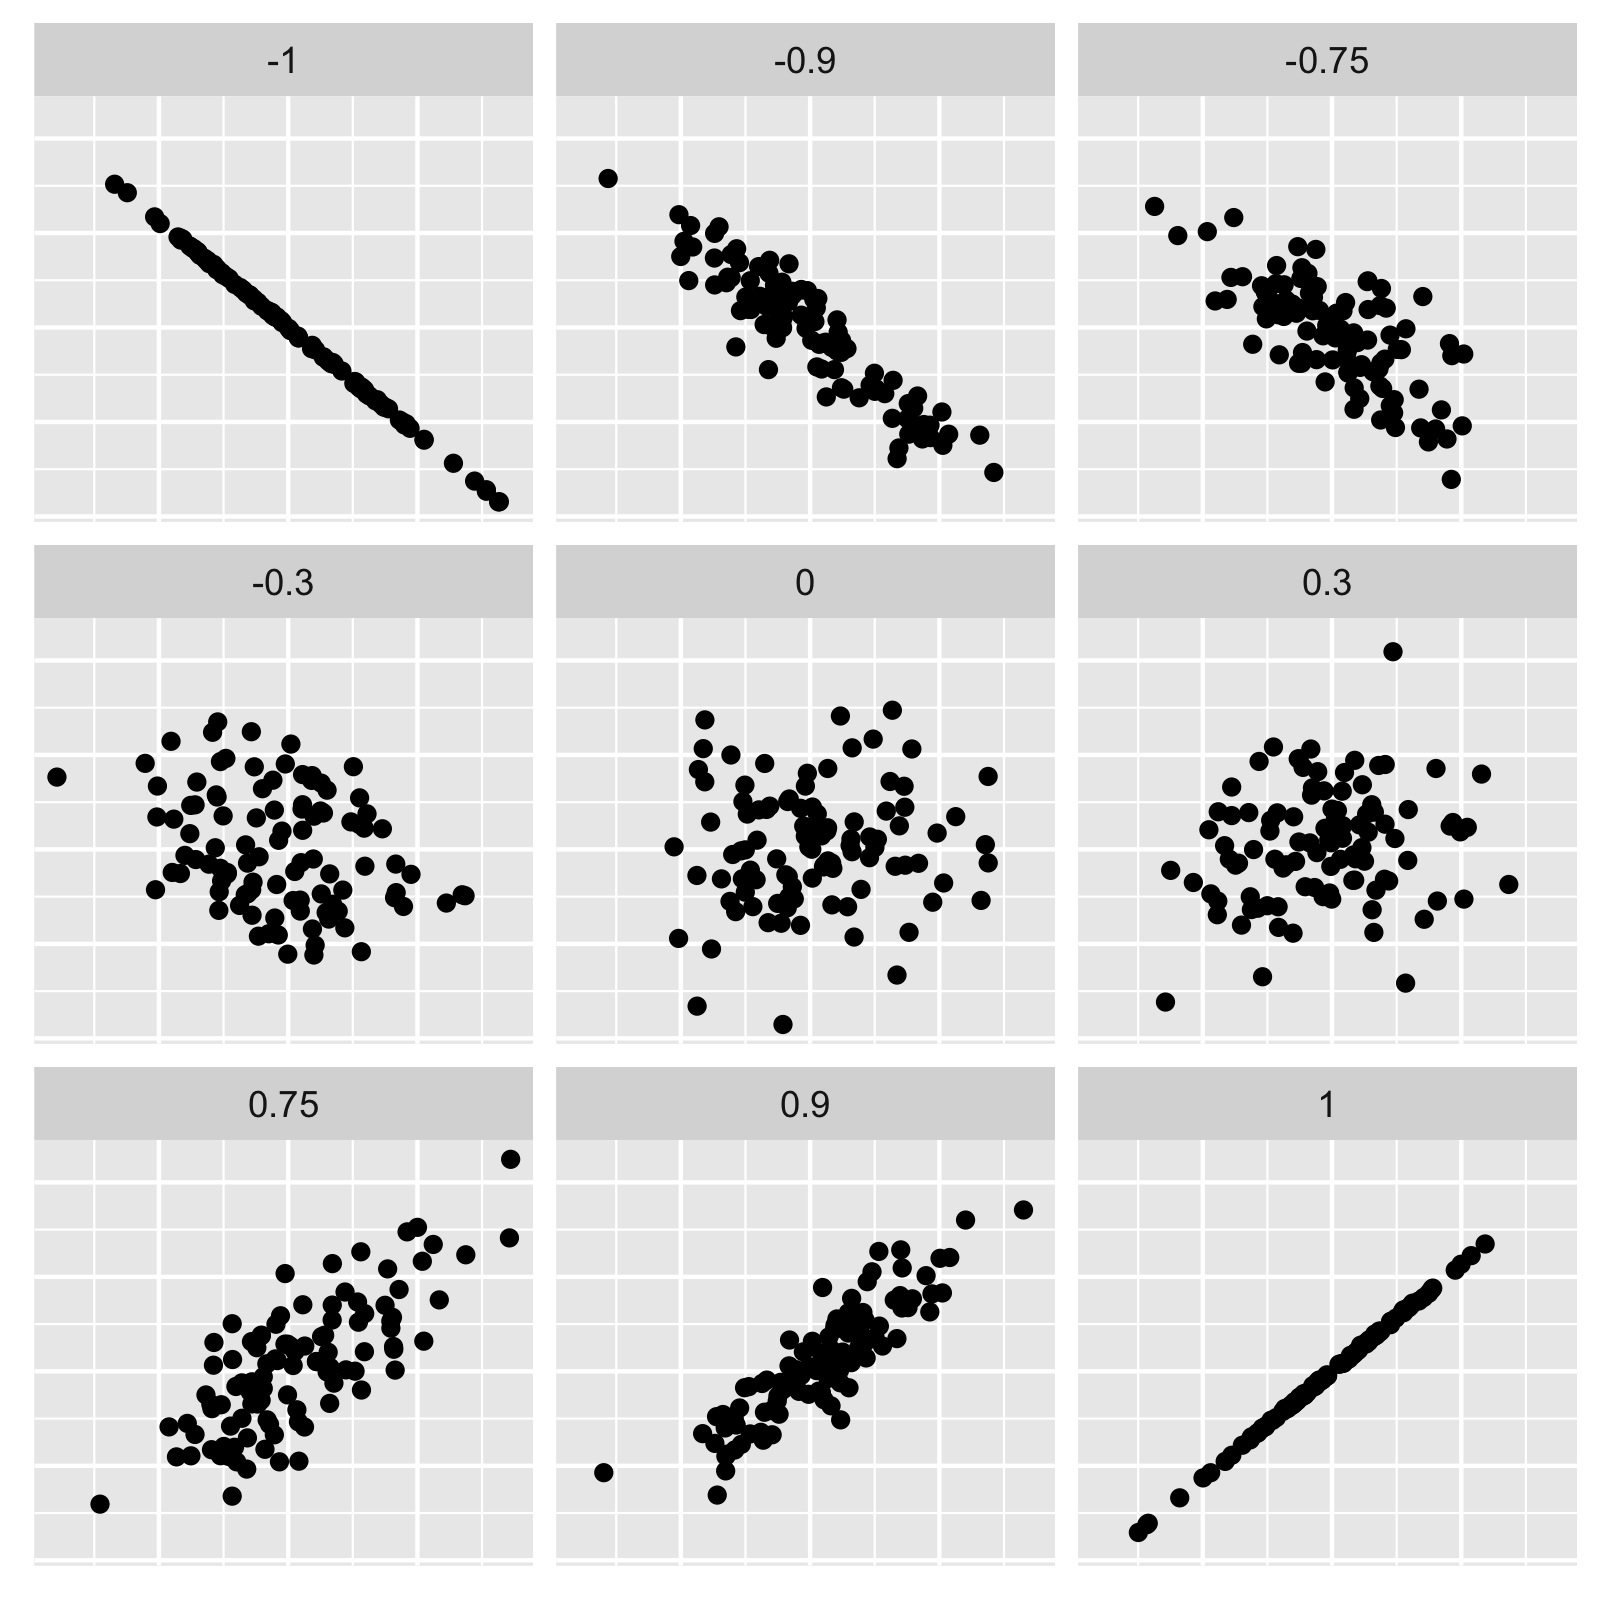
相関係数

tidyverse で学ぶモデリング

相関係数の計算

evals %>% 
  summarize(correlation = cor(score, age))
# A tibble: 1 x 1
  correlation
        <dbl>
1      -0.107
tidyverse で学ぶモデリング

練習しましょう!

tidyverse で学ぶモデリング

Preparing Video For Download...