Pythonで扱う地理空間データ
Dani Arribas-Bel
Geographic Data Science Lab (University of Liverpool)
countries.plot(column='gdp_per_cap', legend=True)
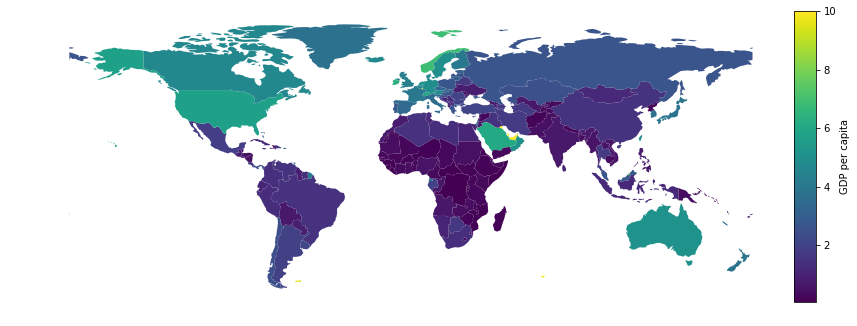
列を指定:
locations.plot(column='variable')
分類スキーム付きのコロプレス図:
locations.plot(column='variable', scheme='quantiles', k=7, cmap='viridis')
主な選択肢:
k)scheme)cmap)locations.plot(column='variable', scheme='Quantiles', k=7, cmap='viridis')
コロプレス図は必然的に情報損失があります(問題ありません)
次のトレードオフ:
k を大きく)k を小さく)目安:クラス(ビン)は3~12
locations.plot(column='variable', scheme='quantiles', k=7, cmap='viridis')
variableの各値をk個のグループにどう割り当てるか?
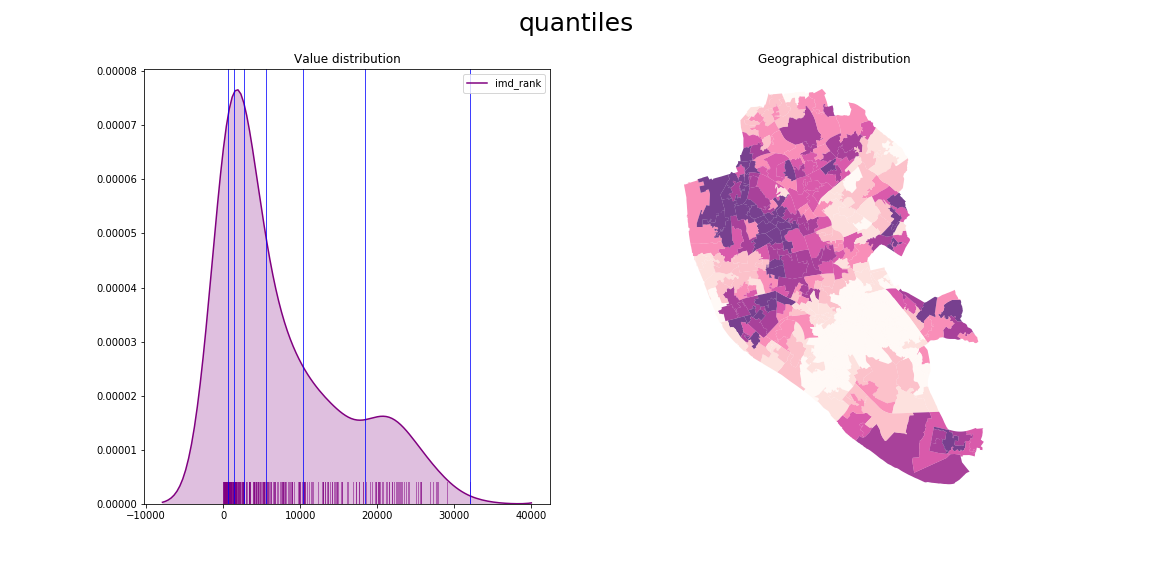
連続変数の(一般的な)方法は2つ:
'equal_interval')'quantiles')locations.plot(column='variable', scheme='equal_interval', k=7, cmap='Purples')
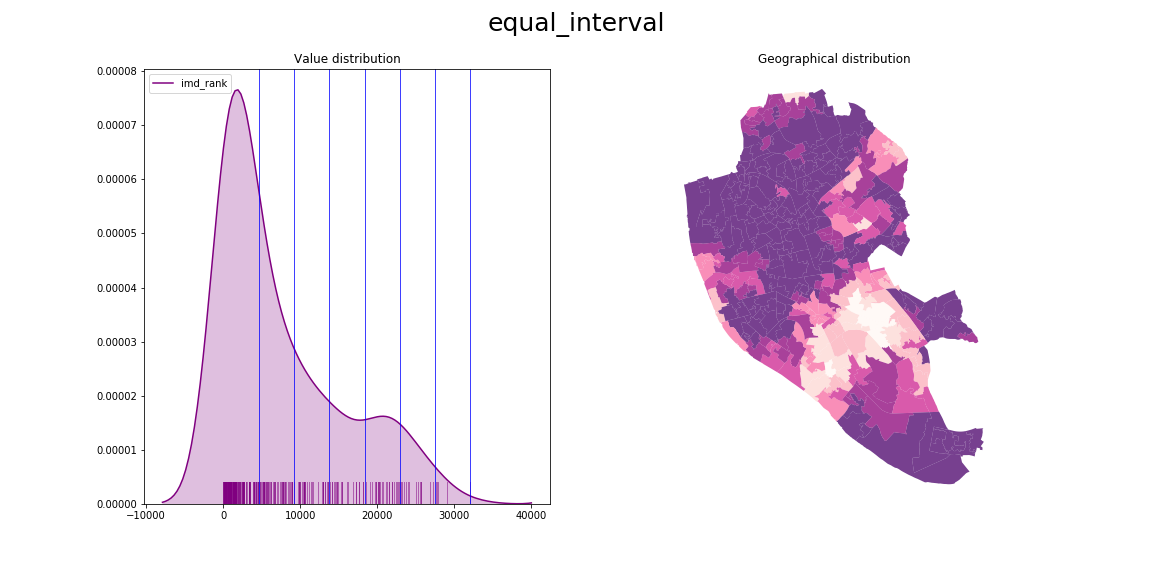
locations.plot(column='variable', scheme='quantiles', k=7, cmap='Purples')
カテゴリ(非序数)
locations.plot(column='variable',
categorical=True, cmap='Purples')
段階式、連続
locations.plot(column='variable',
k=5, cmap='RdPu')
段階式、発散
locations.plot(column='variable',
k=5, cmap='RdYlGn')


重要:目的に合わせる
Pythonで扱う地理空間データ