Pythonで学ぶ時系列データの可視化
Thomas Vincent
Head of Data Science, Getty Images
t_1
t_2
t_3
t_4
t_5
t_6
statsmodels は、様々な統計モデルの推定、統計検定、データ探索のためのクラスと関数を提供するPythonモジュールです。
statsmodels
import matplotlib.pyplot as plt
from statsmodels.graphics import tsaplots
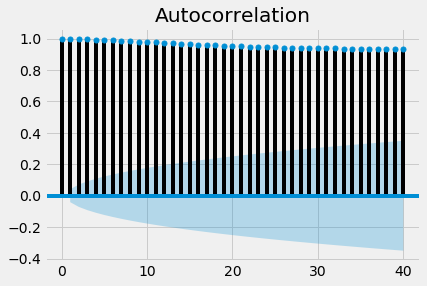
fig = tsaplots.plot_acf(co2_levels['co2'], lags=40)

plt.show()
order 3
t1
t2
t3
t4
t5
t6
import matplotlib.pyplot as plt

from statsmodels.graphics import tsaplots
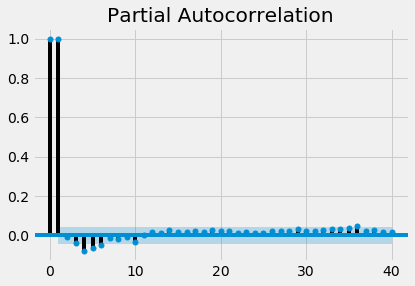
fig = tsaplots.plot_pacf(co2_levels['co2'], lags=40)

plt.show()