単変量の可視化
Pythonで学ぶPlotlyによるデータ可視化入門

Alex Scriven
Data Scientist
ヒストグラム
使用データセット
研究者が収集したペンギンのデータセット:
- くちばし長さ、体重などの各種体測値を含む
- 種、性別、年齢が混在

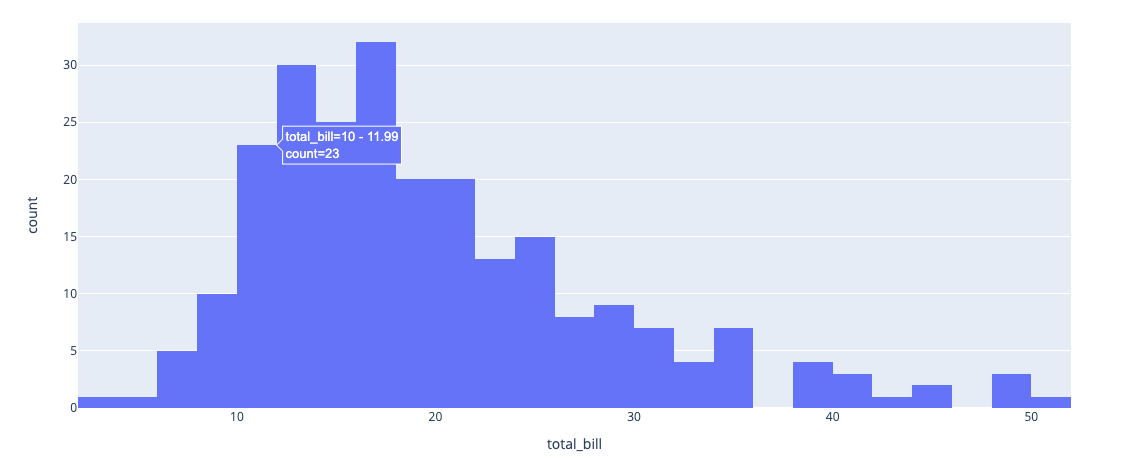
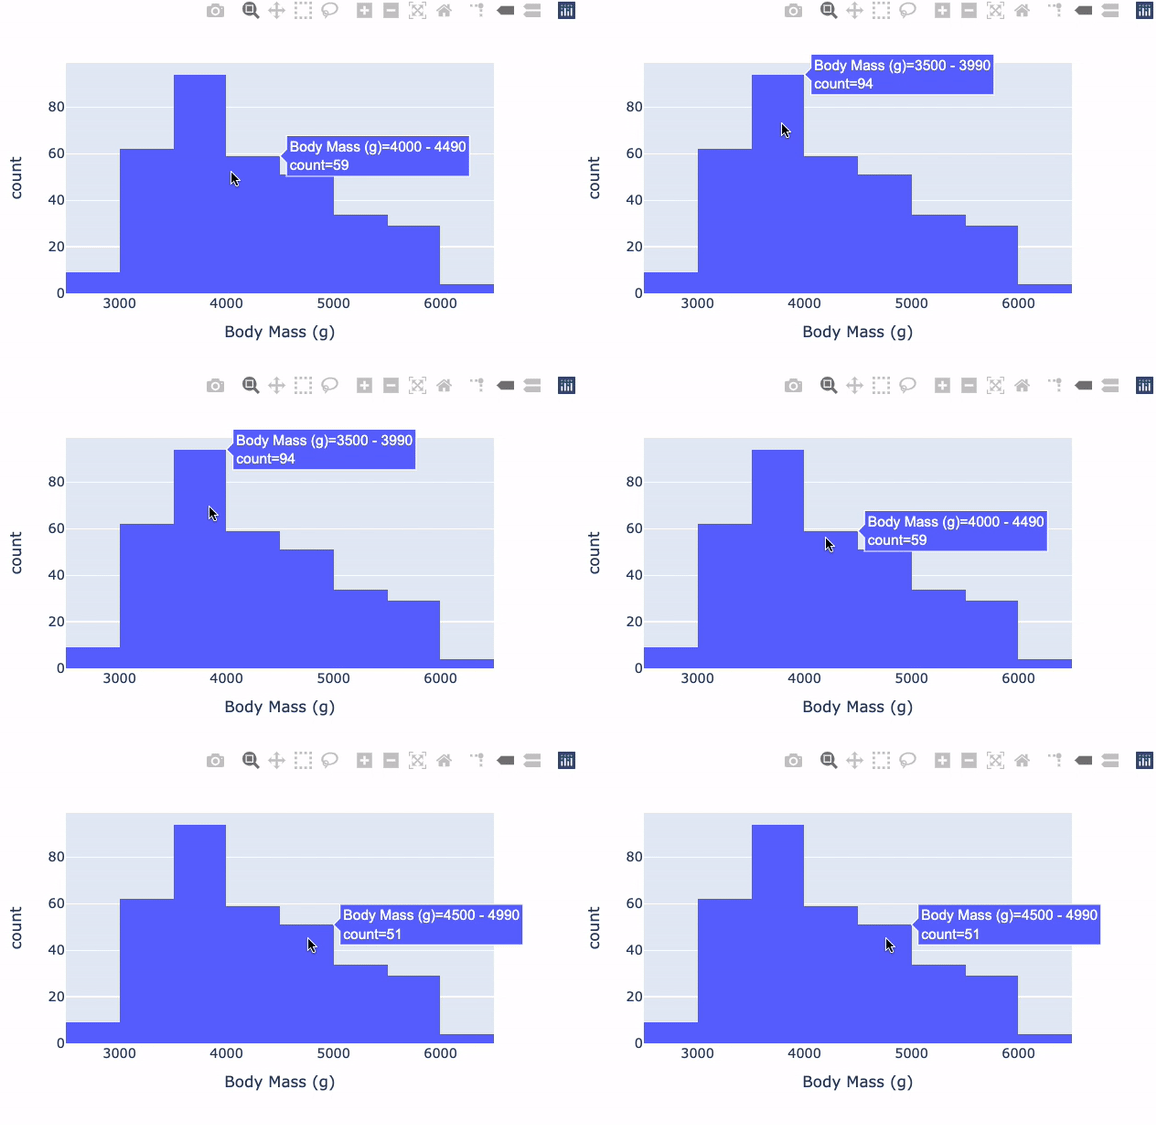
plotly.express でヒストグラム
箱ひげ図(Box-and-Whisker)
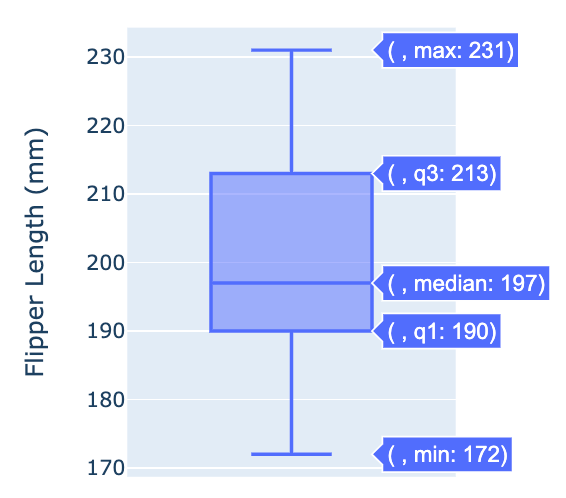
- 点は外れ値
plotly.express で箱ひげ図
Pythonで学ぶPlotlyによるデータ可視化入門
Alex Scriven
Data Scientist
研究者が収集したペンギンのデータセット:

