Rで学ぶ予測入門
Rob J. Hyndman
Professor of Statistics at Monash University
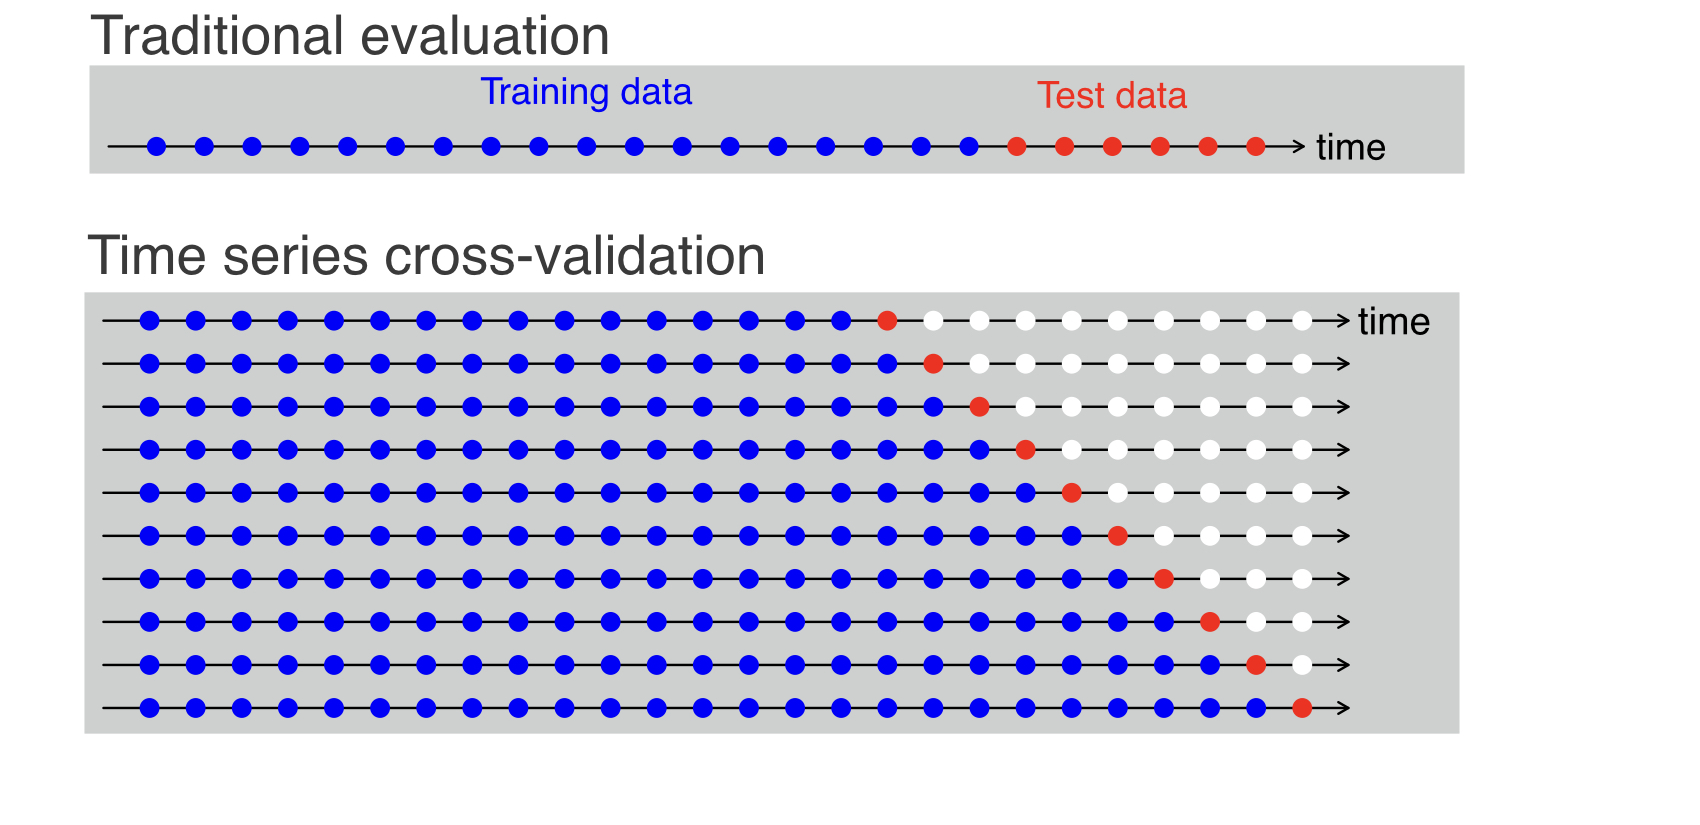
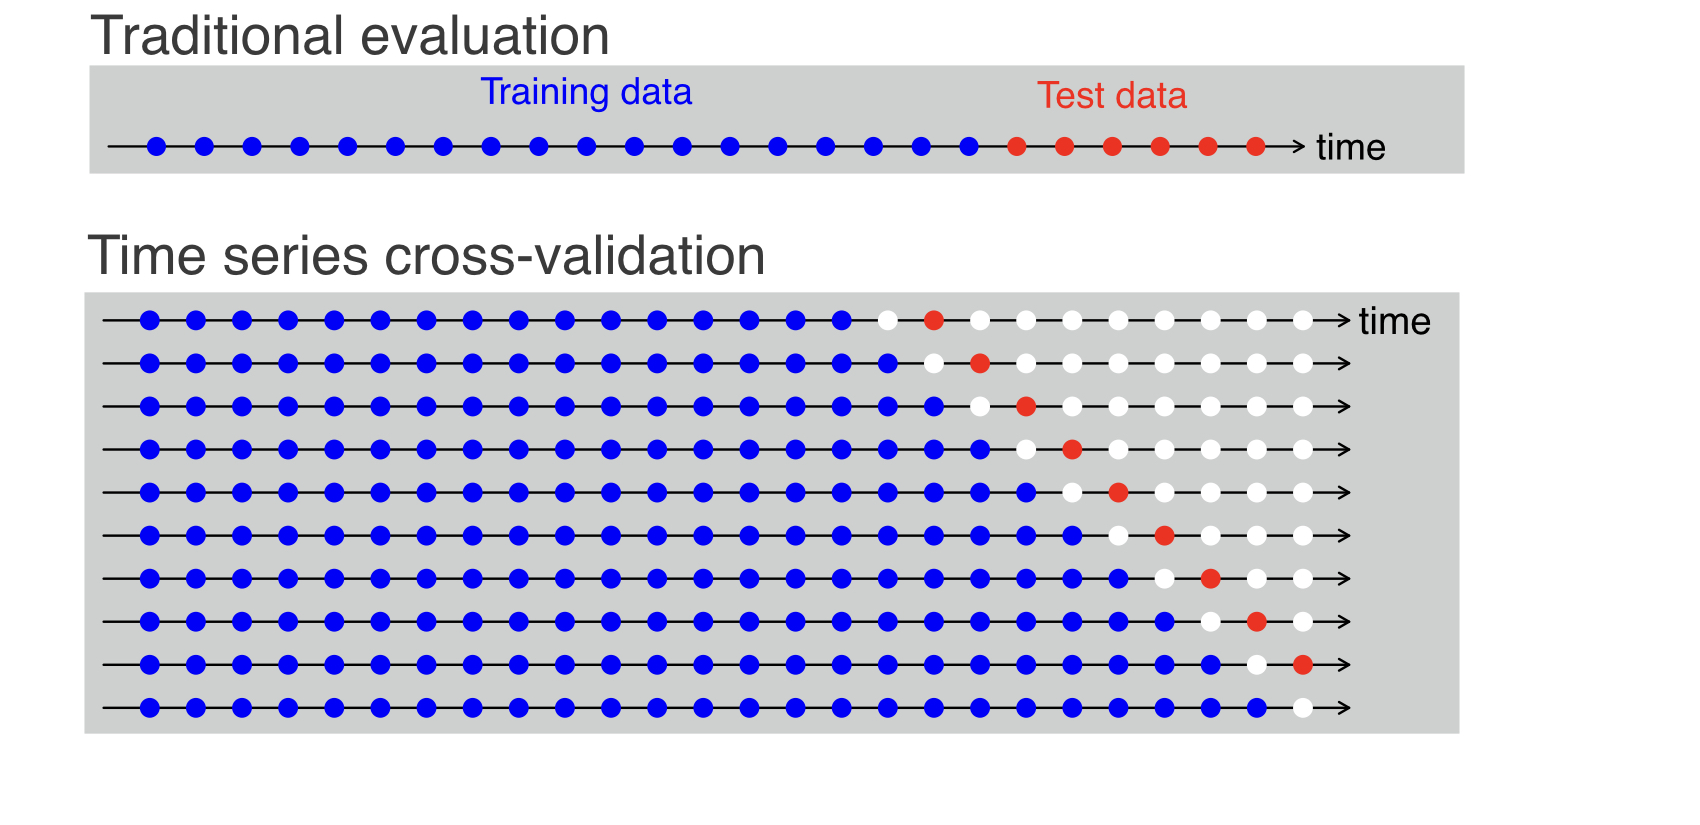
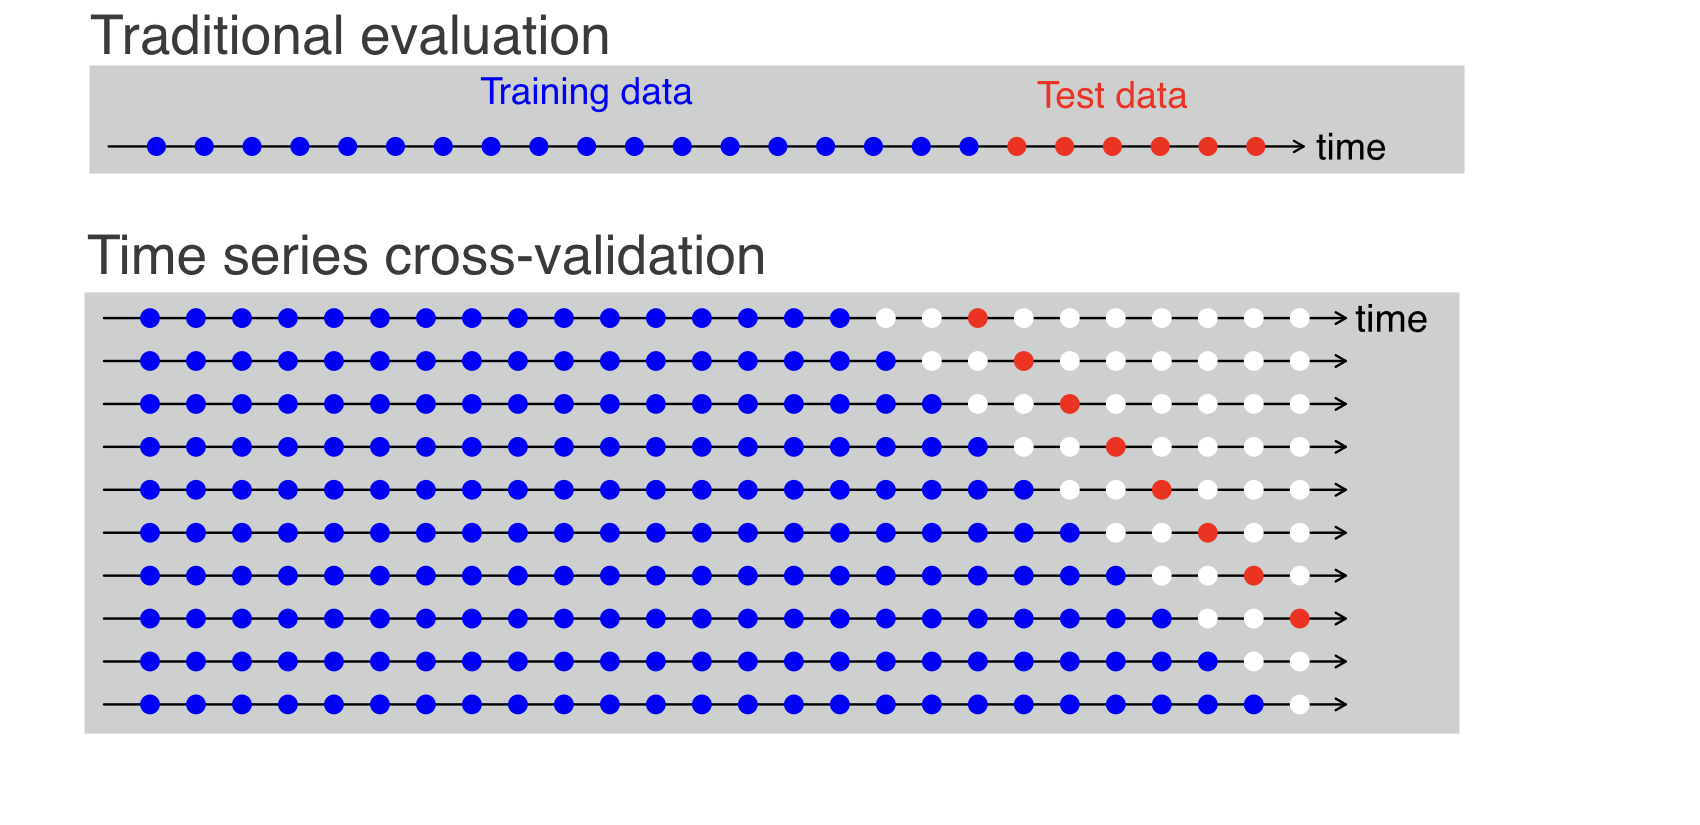
時系列クロスバリデーションでのMSE
e <- tsCV (oil, forecastfunction = naive, h = 1)
mean(e^2 , na.rm = TRUE)
2355.753
推定すべきパラメータがない場合、h=1のtsCVは残差と同じ値になる
  sq <- function(u){u^2}
  tsCV(oil, forecastfunction = naive, h = 10) %>%
    sq() %>% colMeans(na.rm=TRUE)
      h=1       h=2       h=3       h=4       h=5       h=6
 2355.753  5734.838  9842.239 14299.997 18560.887 23264.410
      h=7       h=8       h=9      h=10
26932.799 30766.136 32892.200 32986.214
MSEは予測ホライゾンとともに増加する