スプレッドシートユーザーのための Python
Chris Cardillo
Data Scientist
sns.barplot(x='store',
            y='revenue',
            data=fruit_store_summary,
            hue='product_name')
sns.barplot(x='store',
            y='revenue',
            data=fruit_store_summary,
            hue='product_name')

plt.legend(bbox_to_anchor=(1, 1))
sns.set_style('whitegrid')

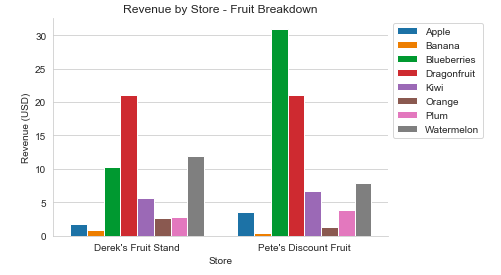
sns.barplot(x='store',
            y='revenue',
            data=fruit_store_summary,
            hue='product_name')

plt.legend(bbox_to_anchor=(1, 1))

plt.title('Revenue by Store - Fruit Breakdown')
plt.xlabel('Store')
plt.ylabel('Revenue (USD)')
sns.despine()
plt.show()