Pythonでの可視化の仕組み

スプレッドシートユーザーのための Python

Chris Cardillo

Data Scientist

追加パッケージのインポート

import seaborn as sns
import matplotlib.pyplot as plt
スプレッドシートユーザーのための Python

プロット関数

  • sns.barplot() - 棒グラフを作成
  • plt.show() - グラフを表示
スプレッドシートユーザーのための Python

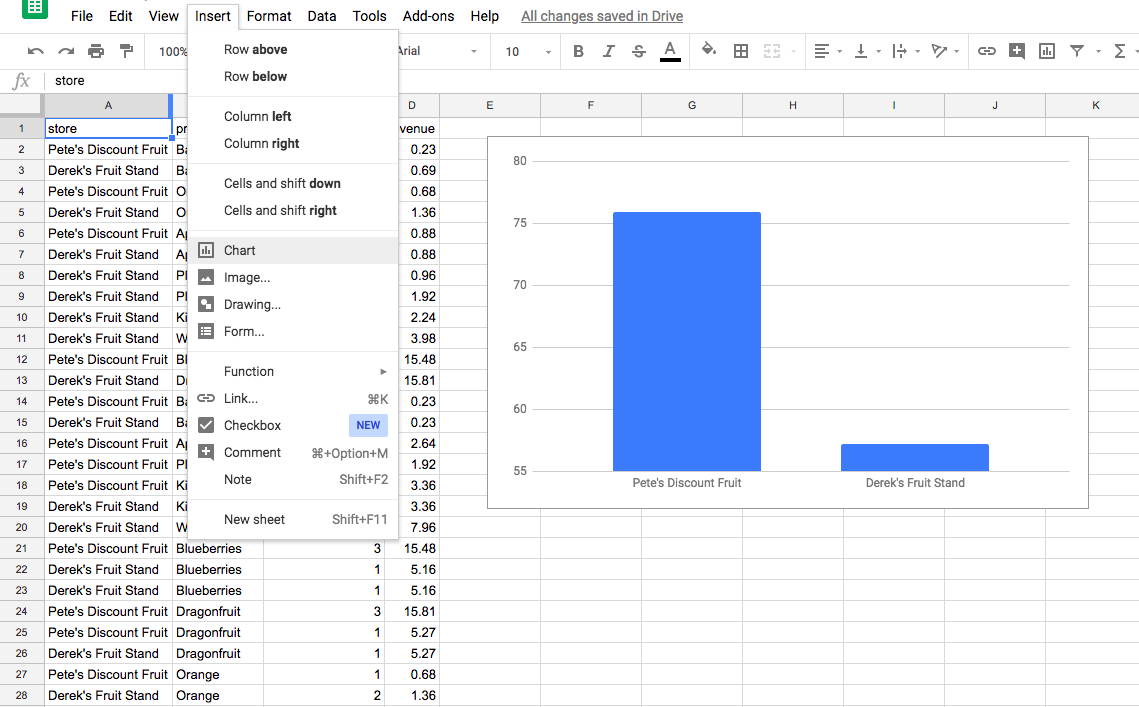
スプレッドシートのグラフ

スプレッドシートのグラフ.png

スプレッドシートユーザーのための Python

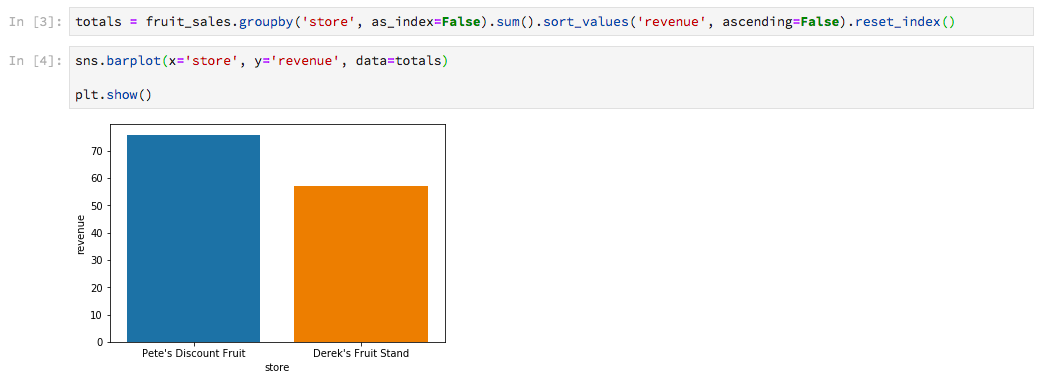
Pythonのグラフ

Pythonノートブックの店舗合計.png

スプレッドシートユーザーのための Python

sns.barplot()

sns.barplot(x='store', y='revenue', data=totals)
スプレッドシートユーザーのための Python

plt.show()

sns.barplot(x='store', y='revenue', data=totals)

plt.show()
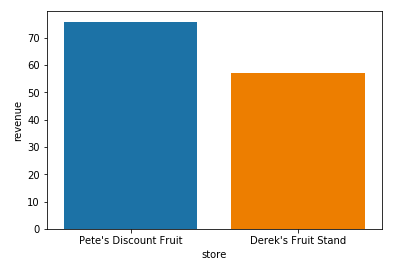
店舗別合計のプロットのみ.png

スプレッドシートユーザーのための Python

plt.savefig()

sns.barplot(x='store', y='revenue', data=totals)

plt.savefig('awesome_plot.png')
スプレッドシートユーザーのための Python

あなたの番です!

スプレッドシートユーザーのための Python

Preparing Video For Download...