効果量

Pythonで学ぶ推測の基礎

Paul Savala

Assistant Professor of Mathematics

効果量とは

医師が折れたタバコを持っている。

  • 効果量: 2 変数間の関係の強さの指標

ジャンクフードの集合。

Pythonで学ぶ推測の基礎

なぜ効果量を測るか

  • 関連の強さを測る
  • 喫煙: 効果量は大
  • 不健康な食事: 効果量は小
Pythonで学ぶ推測の基礎

P値


  • 関連は存在するか
  • 仮説検定に由来

効果量


  • 関連の強さはどの程度か
  • 仮説検定とは独立
Pythonで学ぶ推測の基礎

平均の効果量 - Cohen の d

$n_1 = \text{グループ1の標本サイズ}$

$n_2 = \text{グループ2の標本サイズ}$

$s_1 = \text{グループ1の標準偏差}$

$s_2 = \text{グループ2の標準偏差}$

$\overline{x}_1 = \text{グループ1の平均}$

$\overline{x}_2 = \text{グループ2の平均}$

$s = \displaystyle\sqrt{\frac{(n_1-1)s_1^2 + (n_2-1)s_2^2}{n_1 + n_2 - 2}}$

Cohen の $d = \displaystyle\frac{\overline{x}_1 - \overline{x}_2}{s}$

Pythonで学ぶ推測の基礎

Cohen の d の解釈

  • 0.01 - ごく小
  • 0.20 - 小
  • 0.50 - 中
  • 0.80 - 大
  • 1.20 - 非常に大

Cohen の $d = 0.6$

中〜大の効果量

1 https://books.google.com/books?id=2v9zDAsLvA0C&pg=PP1 https://doi.org/10.22237%2Fjmasm%2F1257035100
Pythonで学ぶ推測の基礎

相関の効果量

r, p_value = stats.pearsonr(
    btc_sp_df['Close_BTC'], 
    btc_sp_df['Close_SP500']
    )

print(r**2)
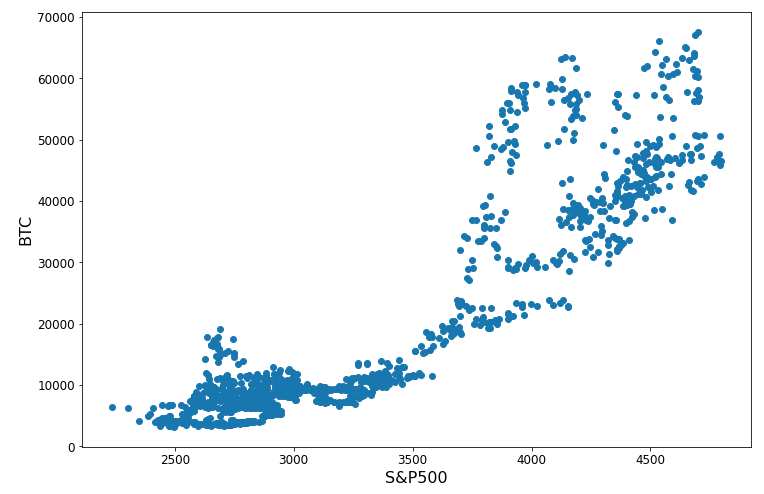
0.82

$R^2:$ 一方の変数を知ることで他方の変動のうち説明できる割合

横軸にS&P500の終値、縦軸にビットコインの終値を取った散布図。右上がりで概ね線形の関係を示す。

Pythonで学ぶ推測の基礎

カテゴリ変数の効果量

  • $\chi^2$ = クロス集計からのカイ二乗統計量
  • $n$ = データ数の合計
  • $d$ = 自由度 = $min(\text{rows}-1, \text{cols}-1)$

Cramer の $V = \displaystyle\sqrt{\frac{\chi^2/n}{d}}$

Pythonで学ぶ推測の基礎

Cramer の V の計算

chi2, p, d, e = stats.chi2_contingency(
    contingency_table)

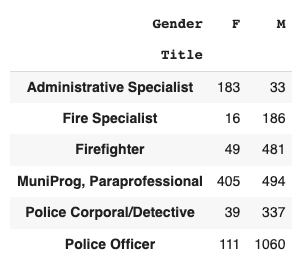
dof = min(6-1, 2-1) = 1 n = 3394
v = np.sqrt((chi2 / n) / dof)
v = 0.52

男性・女性と職種名の表。各職種を男女が何人占めるかを示す。

1 https://en.wikipedia.org/wiki/Degrees_of_freedom_(statistics)
Pythonで学ぶ推測の基礎

Cramer の V の解釈

Cramer's V = 0.52, Degrees of Freedom = 1
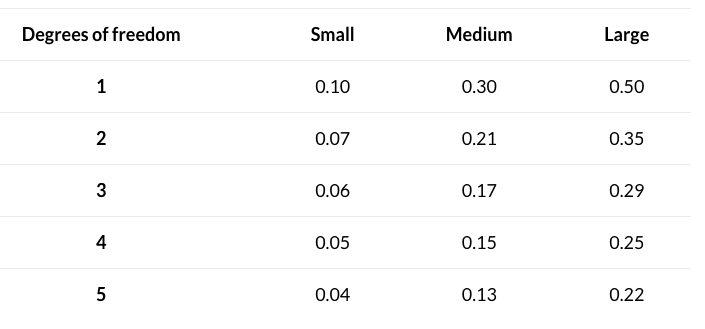
自由度1〜5に対し、小・中・大の効果量に必要な Cramer の V を示す表。小: 0.1, 0.07, 0.06, 0.05, 0.04。中: 0.3, 0.21, 0.17, 0.15, 0.13。大: 0.5, 0.35, 0.29, 0.25, 0.22。

1 https://www.statology.org/interpret-cramers-v
Pythonで学ぶ推測の基礎

練習しましょう!

Pythonで学ぶ推測の基礎

Preparing Video For Download...