R で学ぶクレジットリスク・モデリング
Lore Dirick
Manager of Data Science Curriculum at Flatiron School


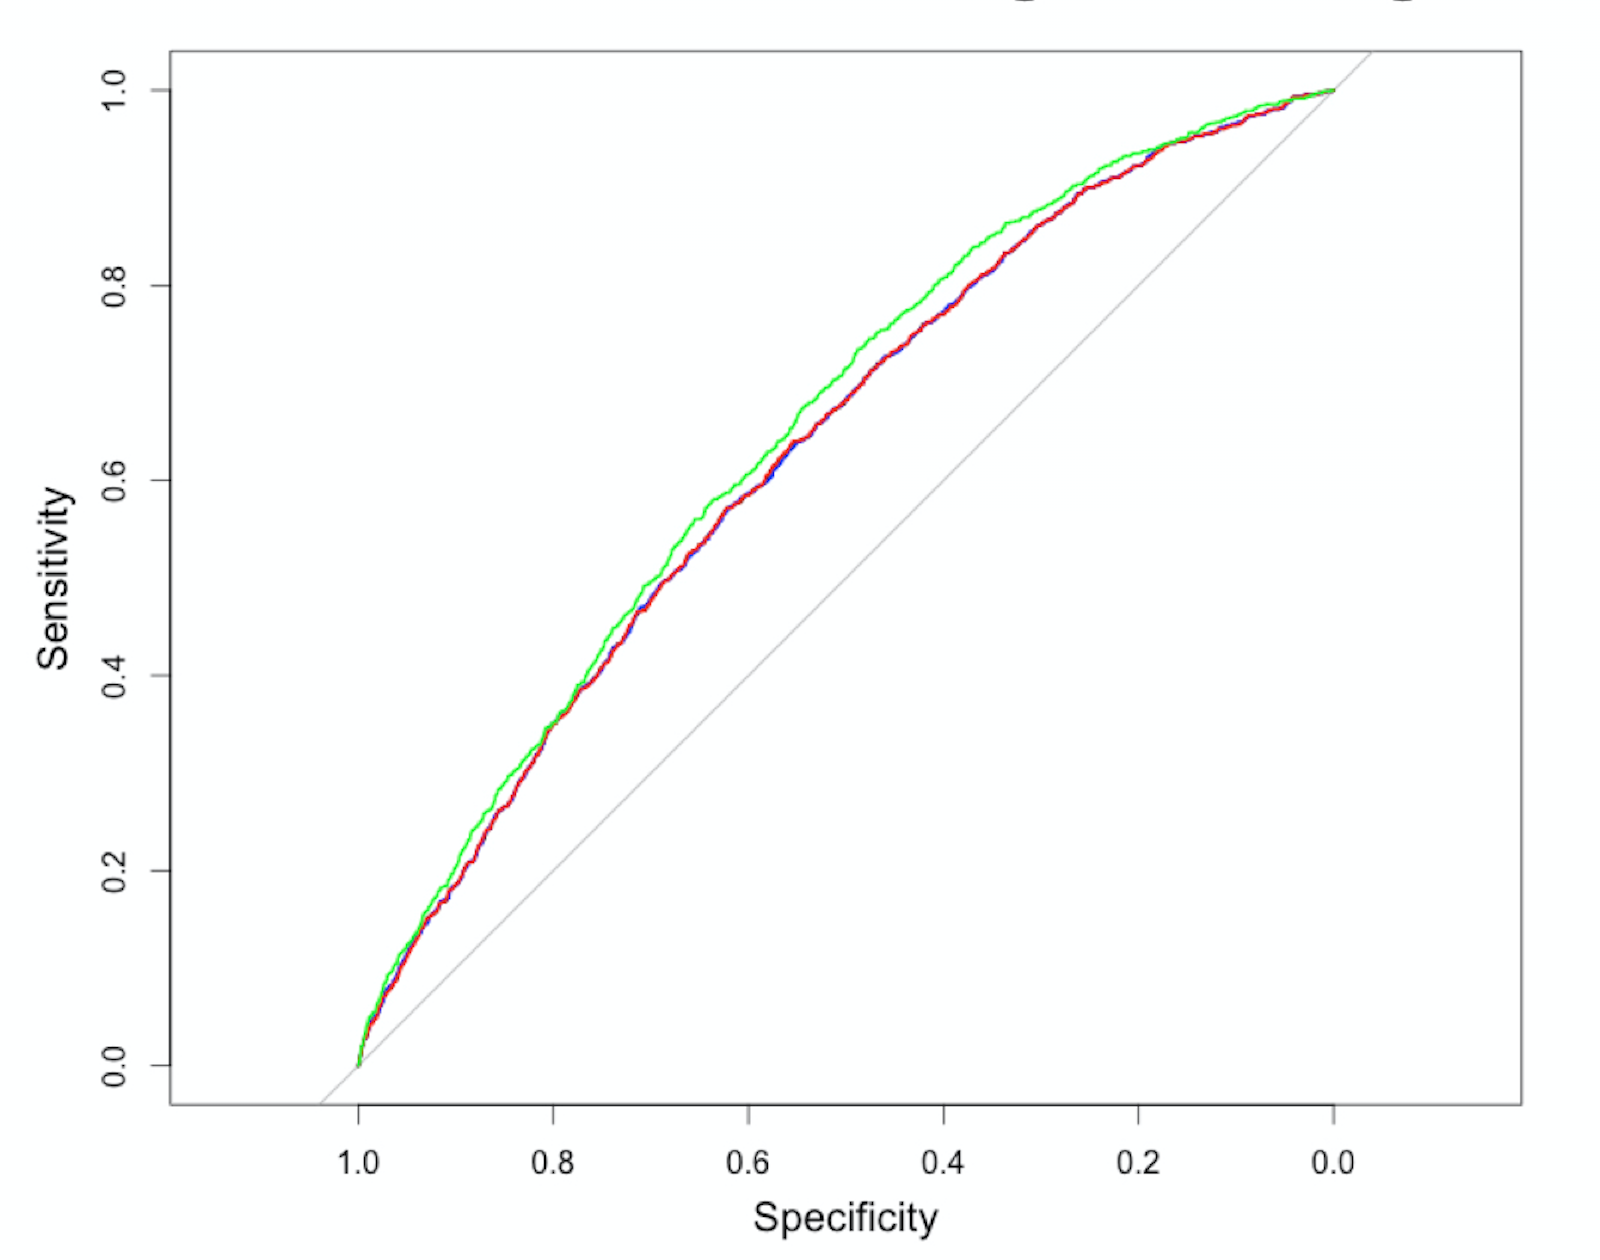
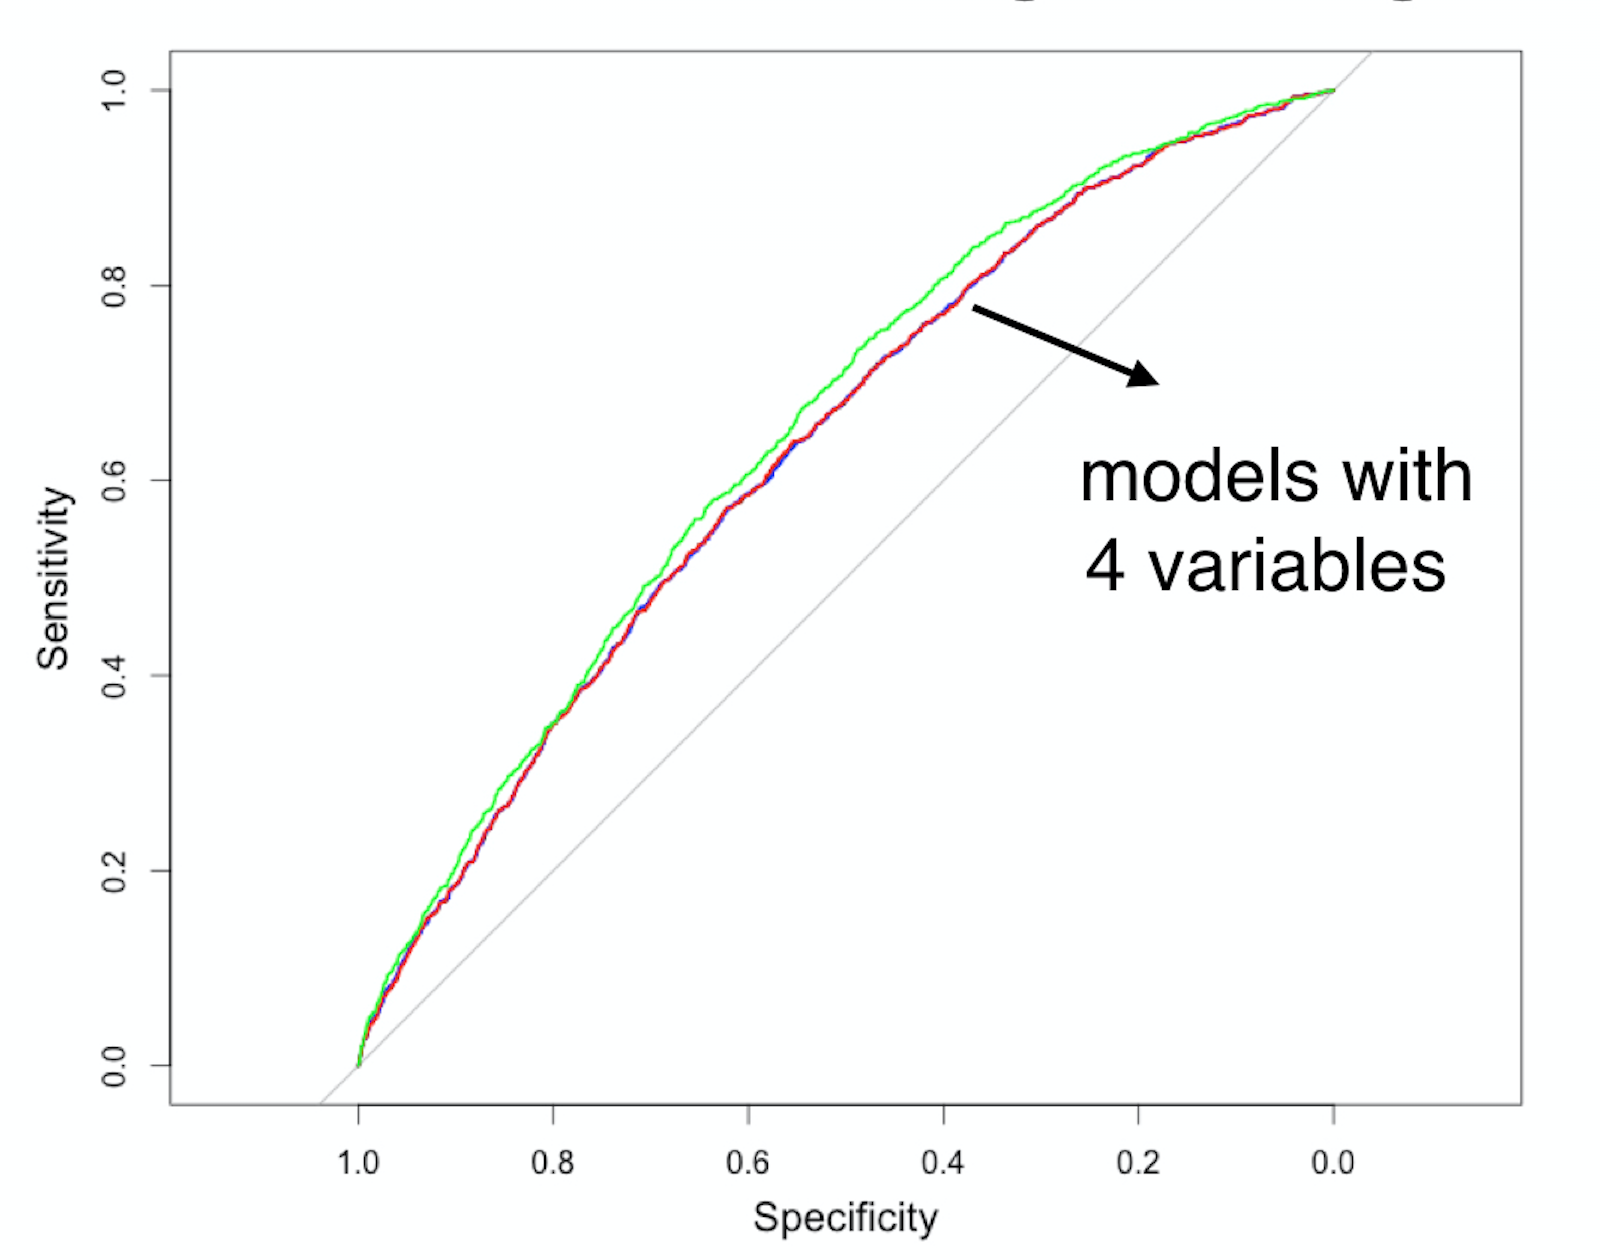
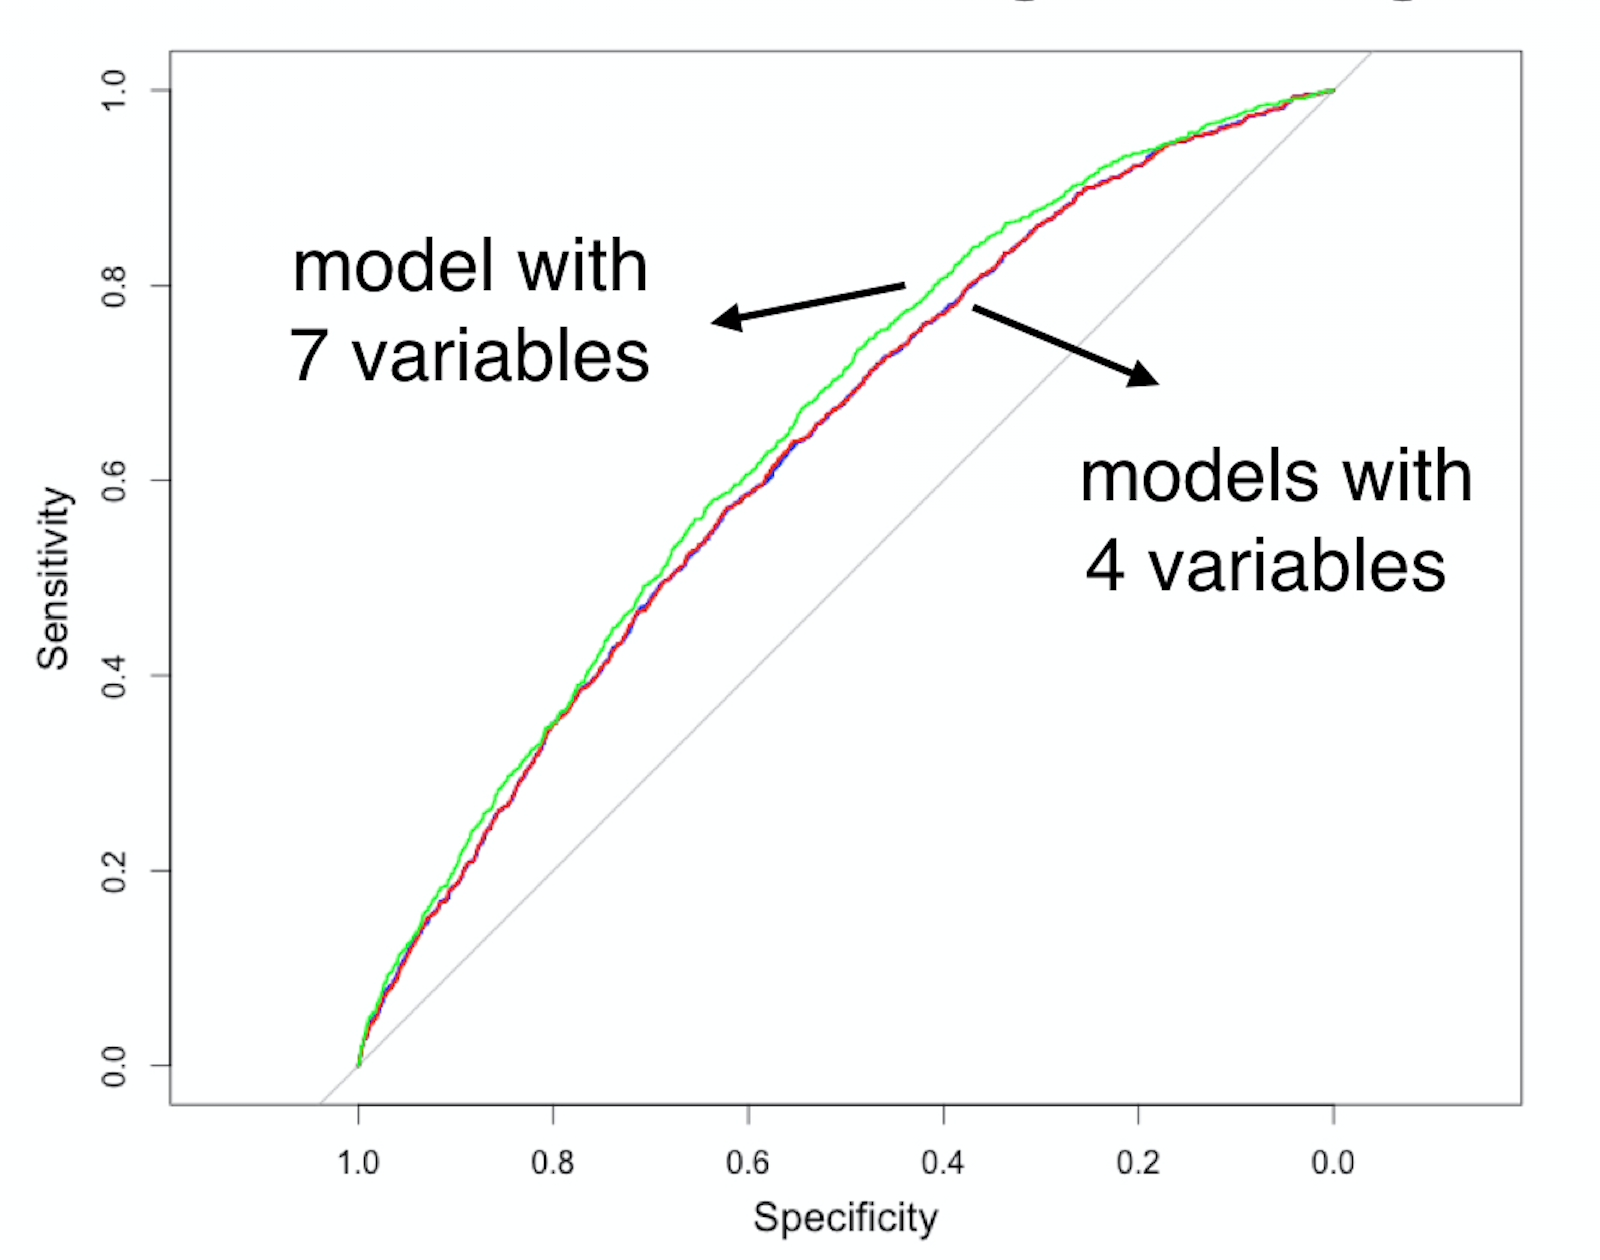
1) すべての変数を含むモデル(本例では 7 つ)で開始し、AUC を算出
log_model_full <- glm(loan_status ~ loan_amnt + grade + home_ownership +
annual_inc + age + emp_cat + ir_cat,
family = "binomial", data = training_set)
predictions_model_full <- predict(log_model_full,
newdata = test_set, type ="response")
AUC_model_full <- auc(test_set$loan_status, predictions_model_full)
Area under the curve: 0.6512
2) 変数を 1 つずつ除いた 7 つの新モデルを作成し、テストセットで PD 予測を実行
log_1_remove_amnt <- glm(loan_status ~ grade + home_ownership + annual_inc + age + emp_cat + ir_cat,
family = "binomial",
data = training_set)
log_1_remove_grade <- glm(loan_status ~ loan_amnt + home_ownership + annual_inc + age + emp_cat + ir_cat,
family = "binomial",
data = training_set)
log_1_remove_home <- glm(loan_status ~ loan_amnt + grade + annual_inc + age + emp_cat + ir_cat,
family = "binomial",
data = training_set)
pred_1_remove_amnt <- predict(log_1_remove_amnt, newdata = test_set, type = "response")
pred_1_remove_grade <- predict(log_1_remove_grade, newdata = test_set, type = "response")
pred_1_remove_home <- predict(log_1_remove_home, newdata = test_set, type = "response")
...
3) 最良の AUC を出したモデルを採用(完全モデルの AUC: 0.6512)
auc(test_set$loan_status, pred_1_remove_amnt)
Area under the curve: 0.6537
auc(test_set$loan_status, pred_1_remove_grade)
Area under the curve: 0.6438
auc(test_set$loan_status, pred_1_remove_home)
Area under the curve: 0.6537
4) AUC が(有意に)低下するまで繰り返す
R で学ぶクレジットリスク・モデリング