ROC曲線

R で学ぶクレジットリスク・モデリング

Lore Dirick

Manager of Data Science Curriculum at Flatiron School

ここまでのまとめ

  • 戦略表/曲線:依然として仮定が必要
  • 「全体として」最良のモデルは?
R で学ぶクレジットリスク・モデリング

混同行列

$$

実際の返済状況 vs モデル予測

延滞なし (0) 延滞あり (1)
延滞なし (0) TN FP
延滞あり (1) FN TP

$$

$\text{Accuracy} = \frac{TP +TN}{TP + FP + TN + FN}$

$\text{Sensitivity} = \frac{TP}{TP + FN}$

$\text{Specificity} = \frac{TN}{TN + FP}$

R で学ぶクレジットリスク・モデリング

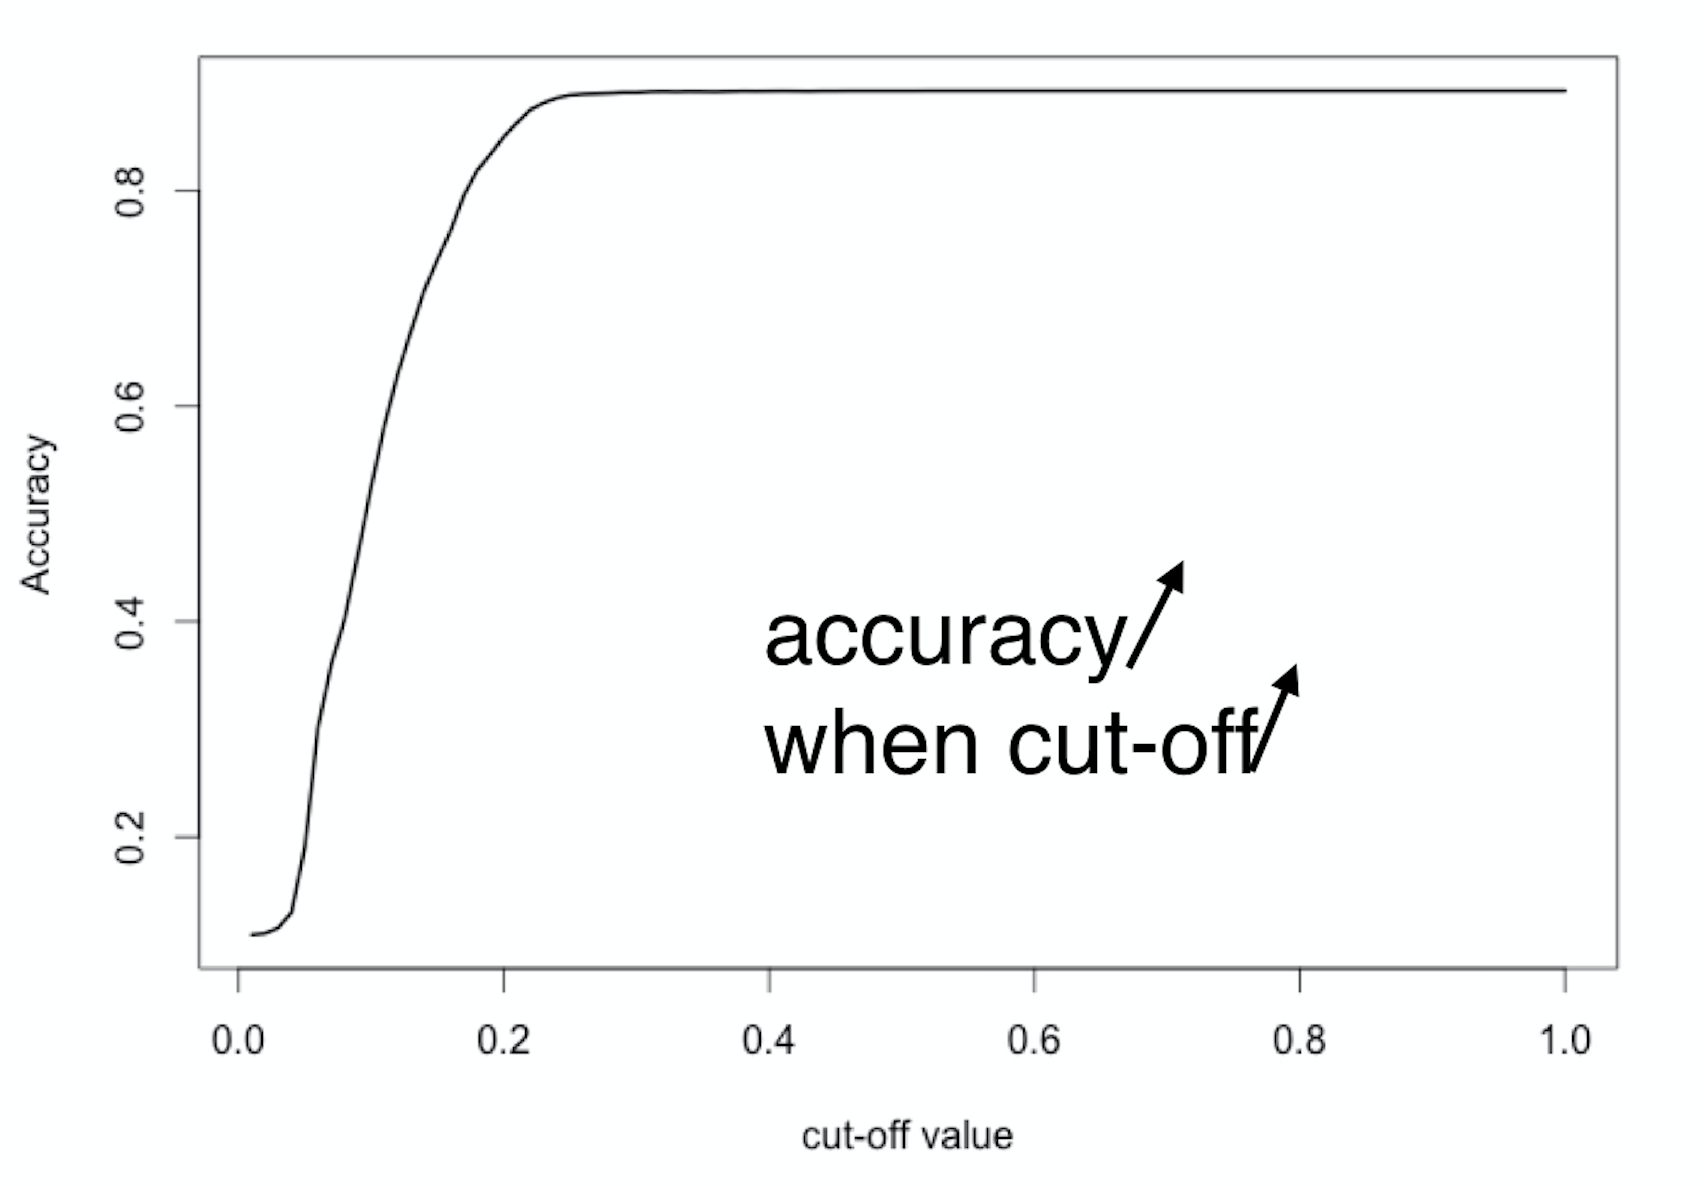
正解率は?

$$

2020-06-22 6.21.14 PMのスクリーンショット.png

$$

$\text{Sensitivity} = \frac{TP}{TP + FN}$

$\text{Specificity} = \frac{TN}{TN + FP}$

R で学ぶクレジットリスク・モデリング

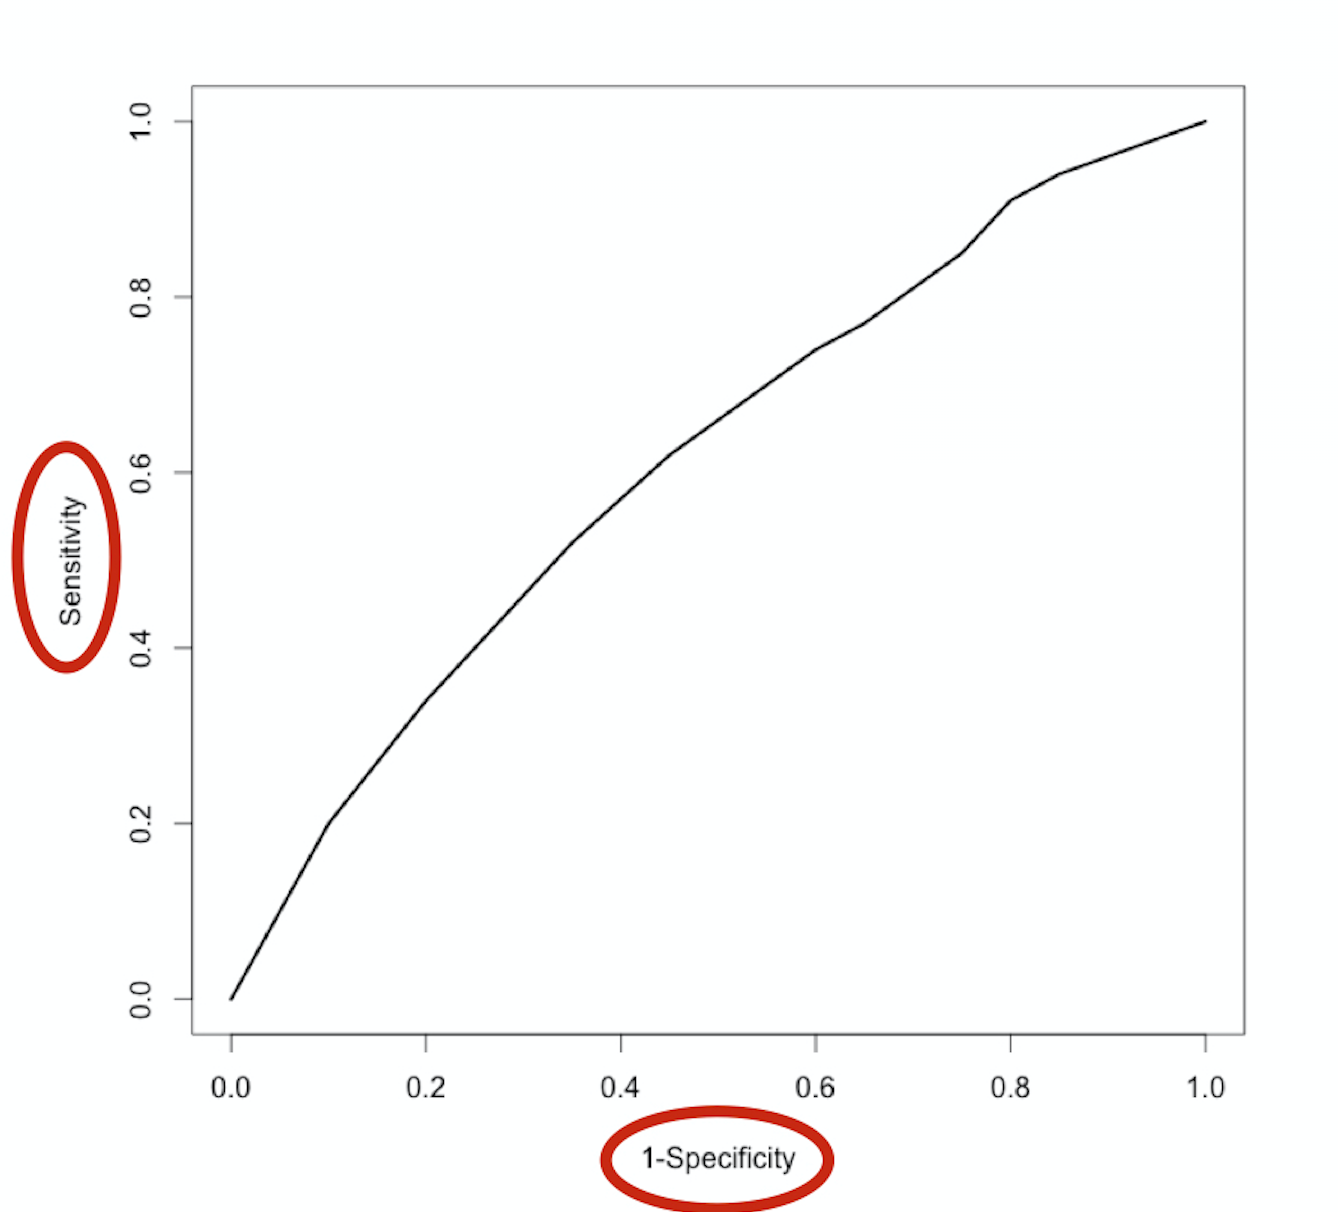
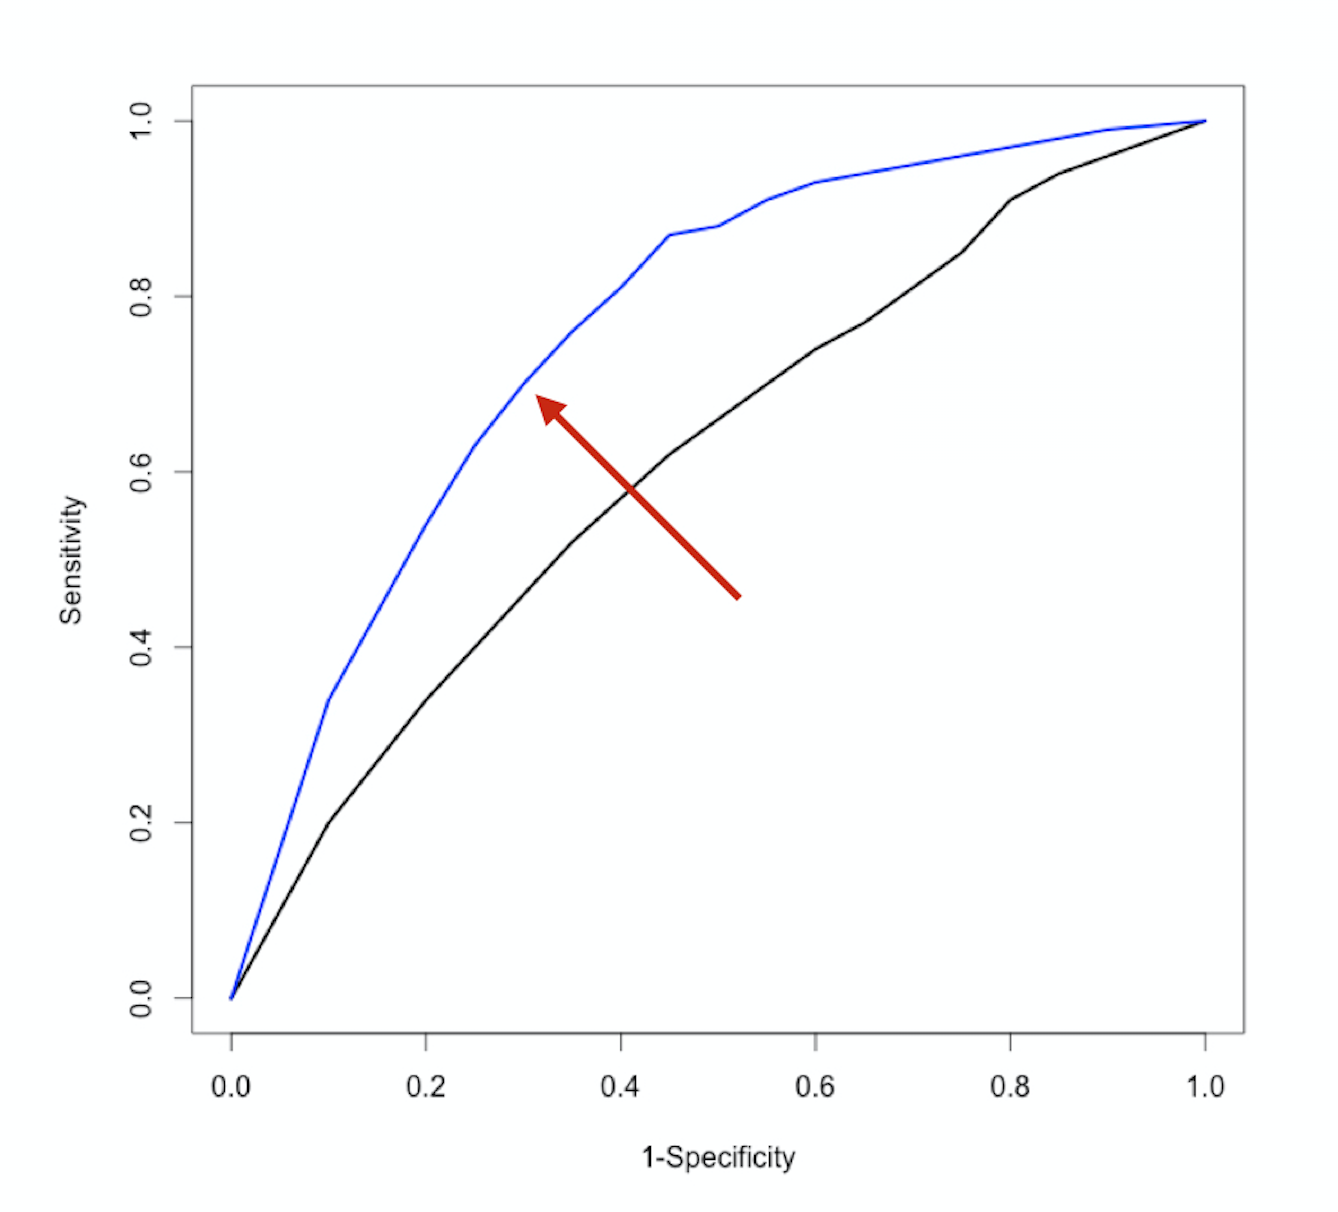
ROC曲線

2020-06-22 6.21.58 PMのスクリーンショット.png

$$

$\text{Sensitivity} = \frac{TP}{TP + FN}$

$\text{Specificity} = \frac{TN}{TN + FP}$

R で学ぶクレジットリスク・モデリング

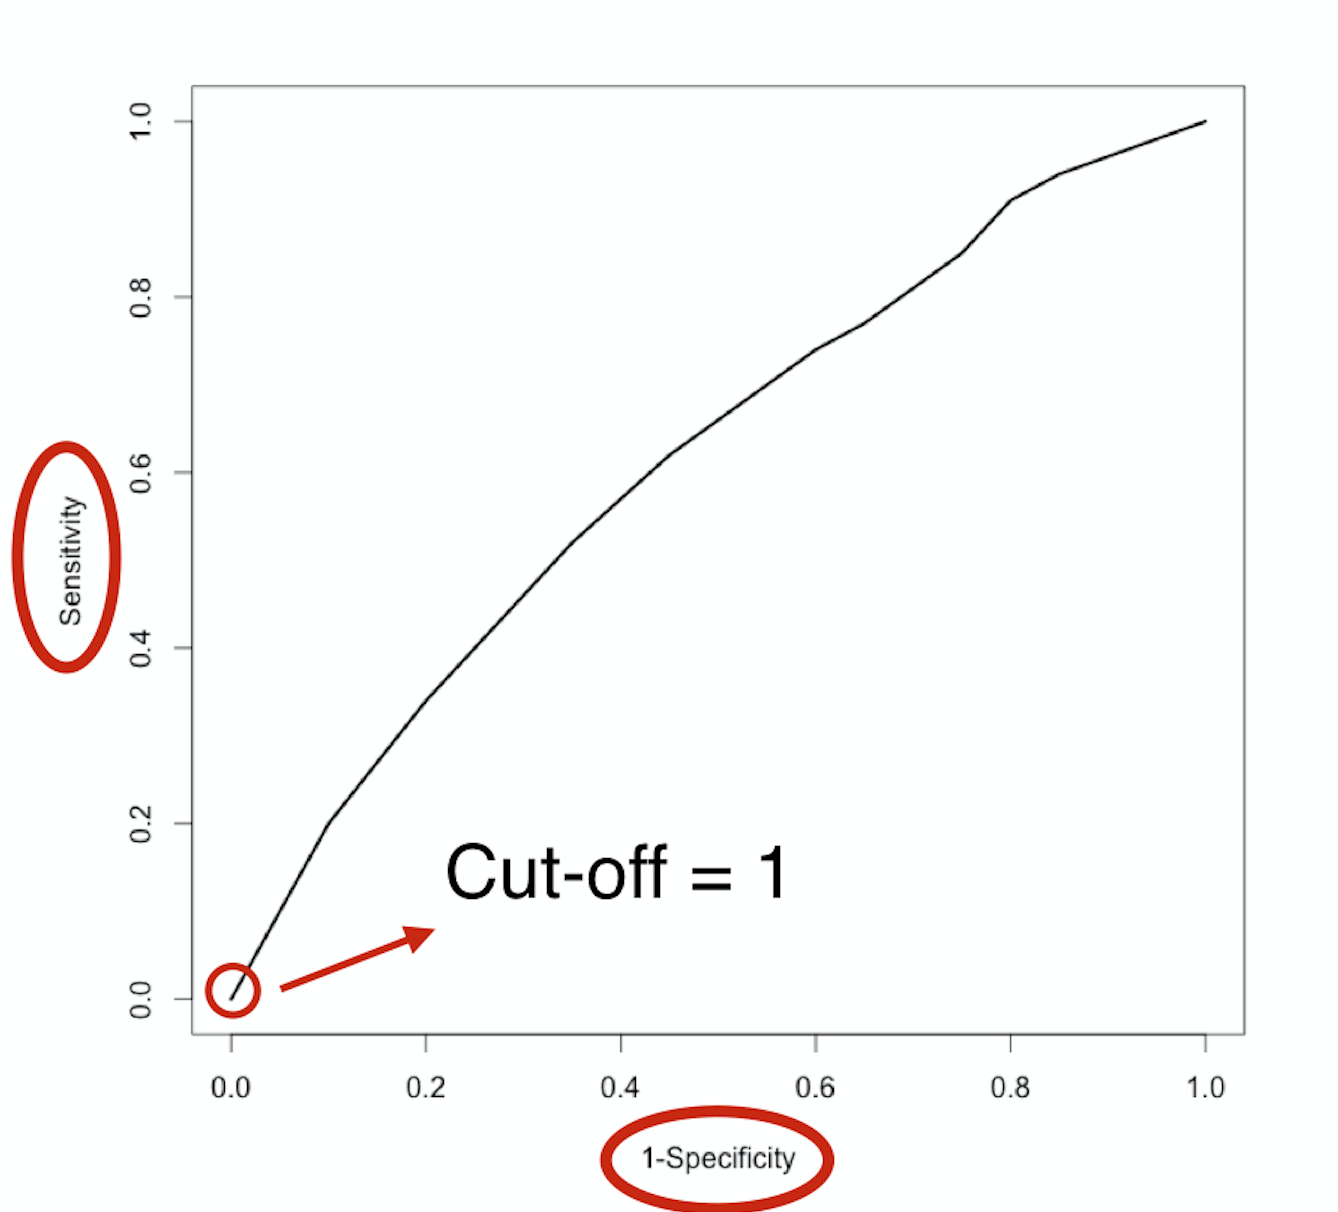
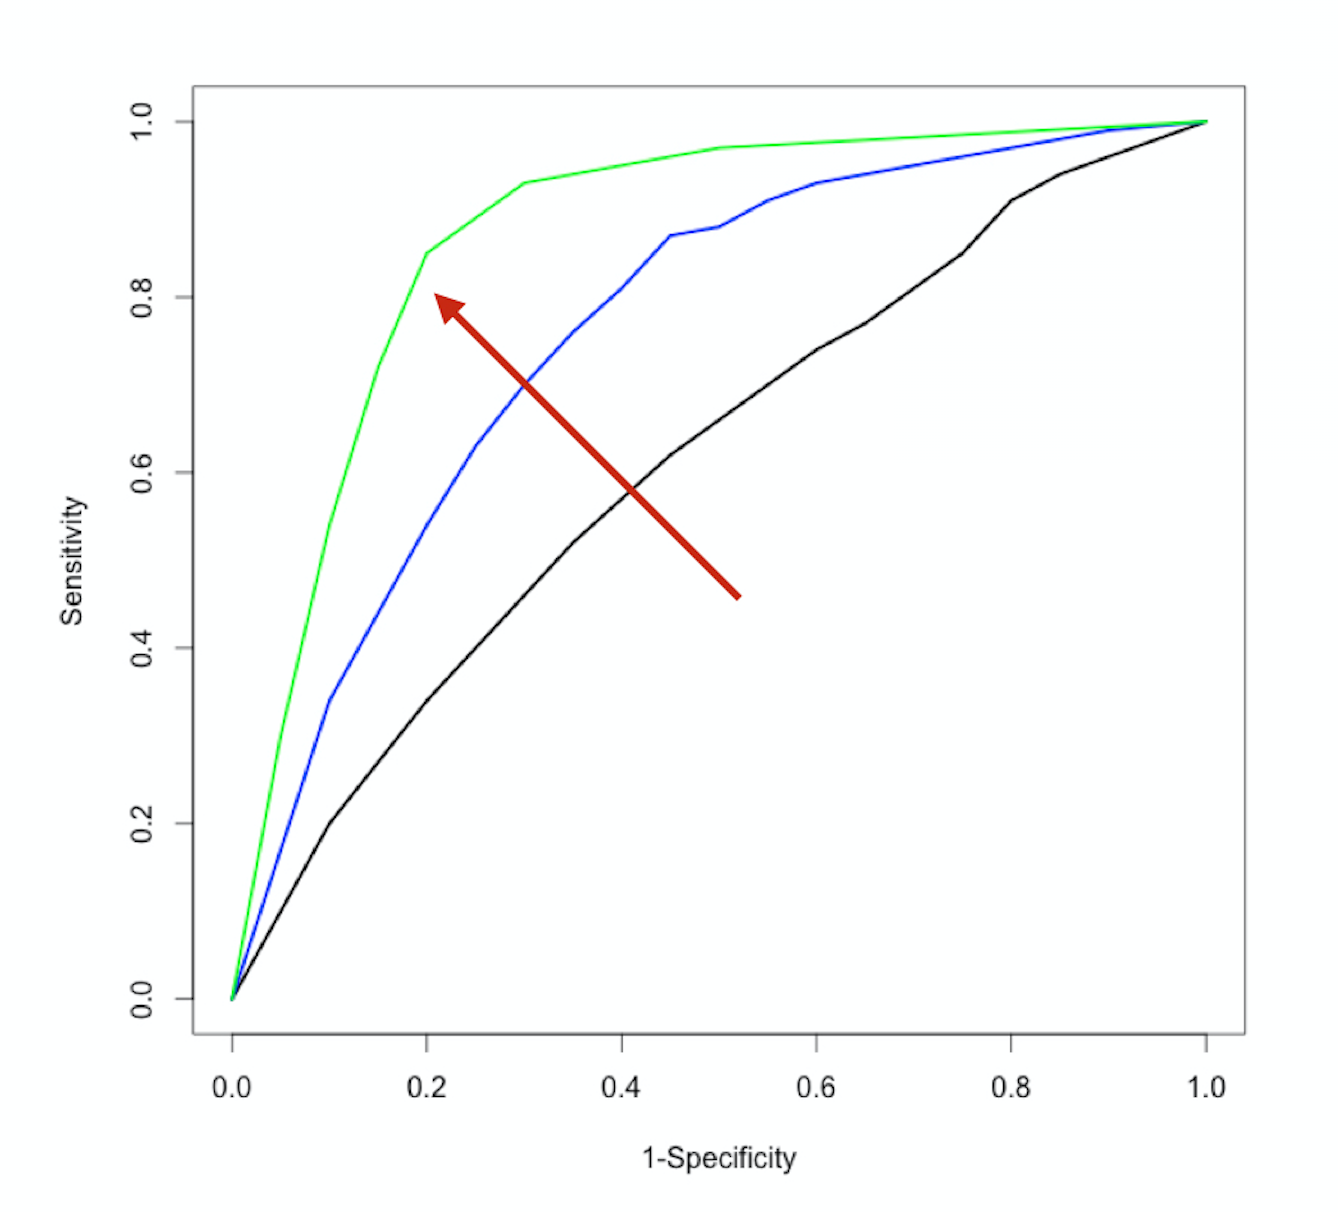
ROC曲線

2020-06-22 6.22.11 PMのスクリーンショット.png

$$

$\text{Sensitivity} = \frac{TP}{TP + FN}$

$\text{Specificity} = \frac{TN}{TN + FP}$

R で学ぶクレジットリスク・モデリング

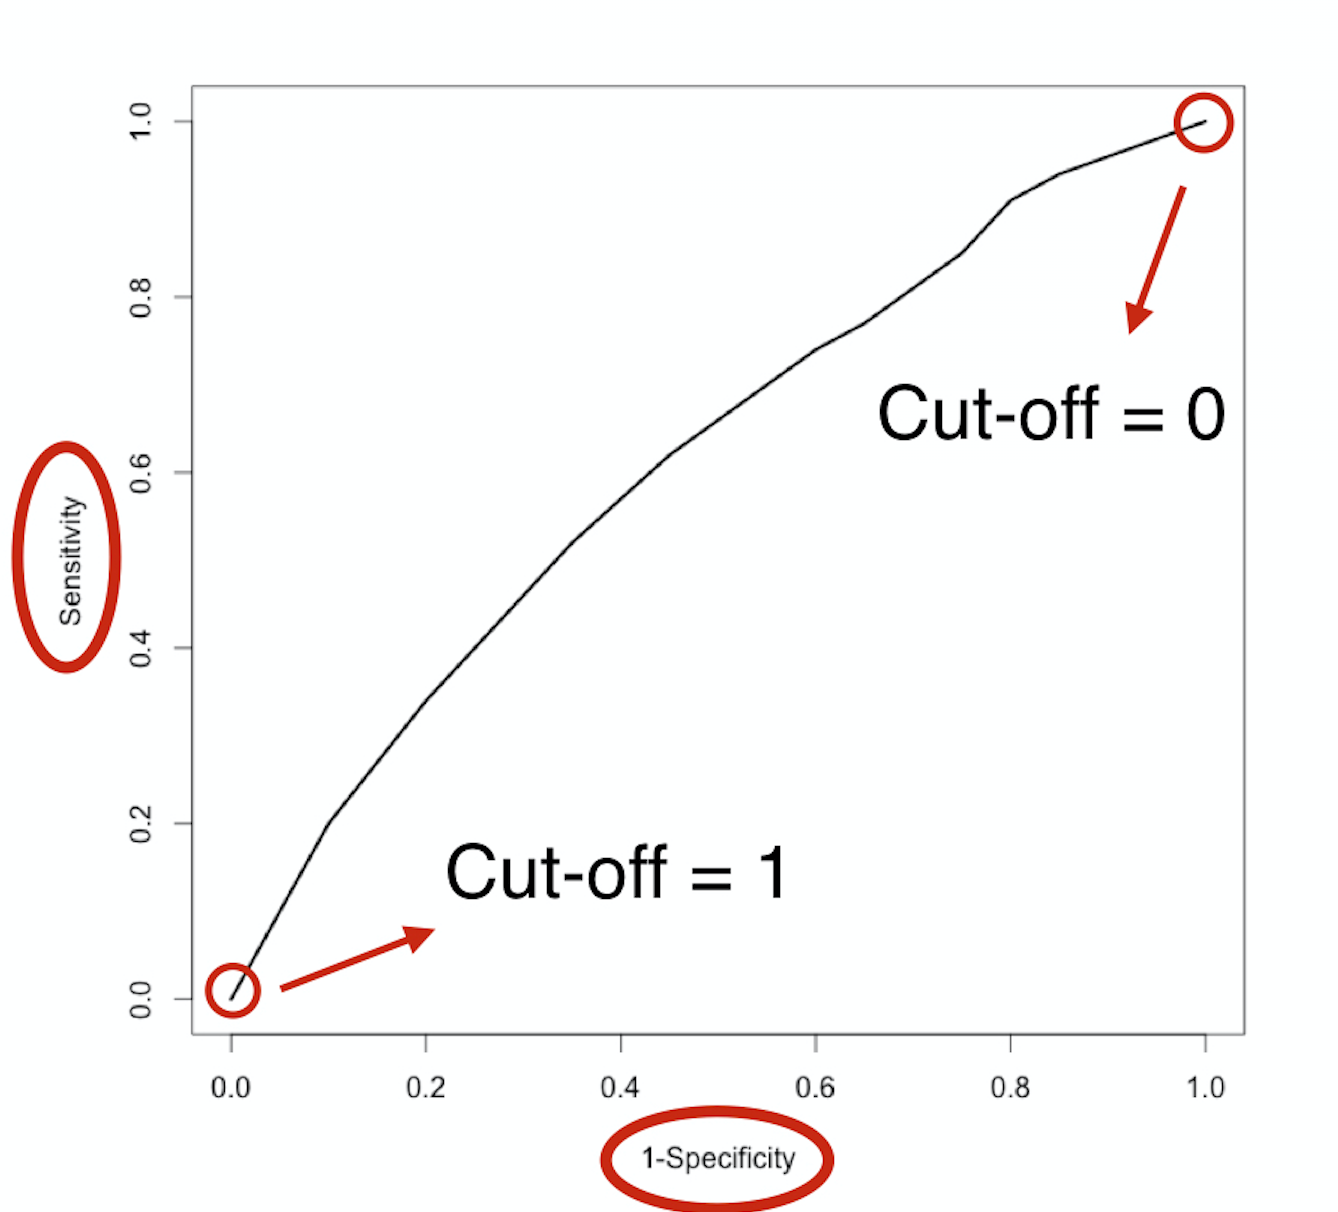
ROC曲線

2020-06-22 6.22.22 PMのスクリーンショット.png

$$

$\text{Sensitivity} = \frac{TP}{TP + FN}$

$\text{Specificity} = \frac{TN}{TN + FP}$

R で学ぶクレジットリスク・モデリング

ROC曲線

2020-06-22 6.22.35 PMのスクリーンショット.png

$$

$\text{Sensitivity} = \frac{TP}{TP + FN}$

$\text{Specificity} = \frac{TN}{TN + FP}$

R で学ぶクレジットリスク・モデリング

ROC曲線

2020-06-22 6.22.45 PMのスクリーンショット.png

$$

$\text{Sensitivity} = \frac{TP}{TP + FN}$

$\text{Specificity} = \frac{TN}{TN + FP}$

R で学ぶクレジットリスク・モデリング

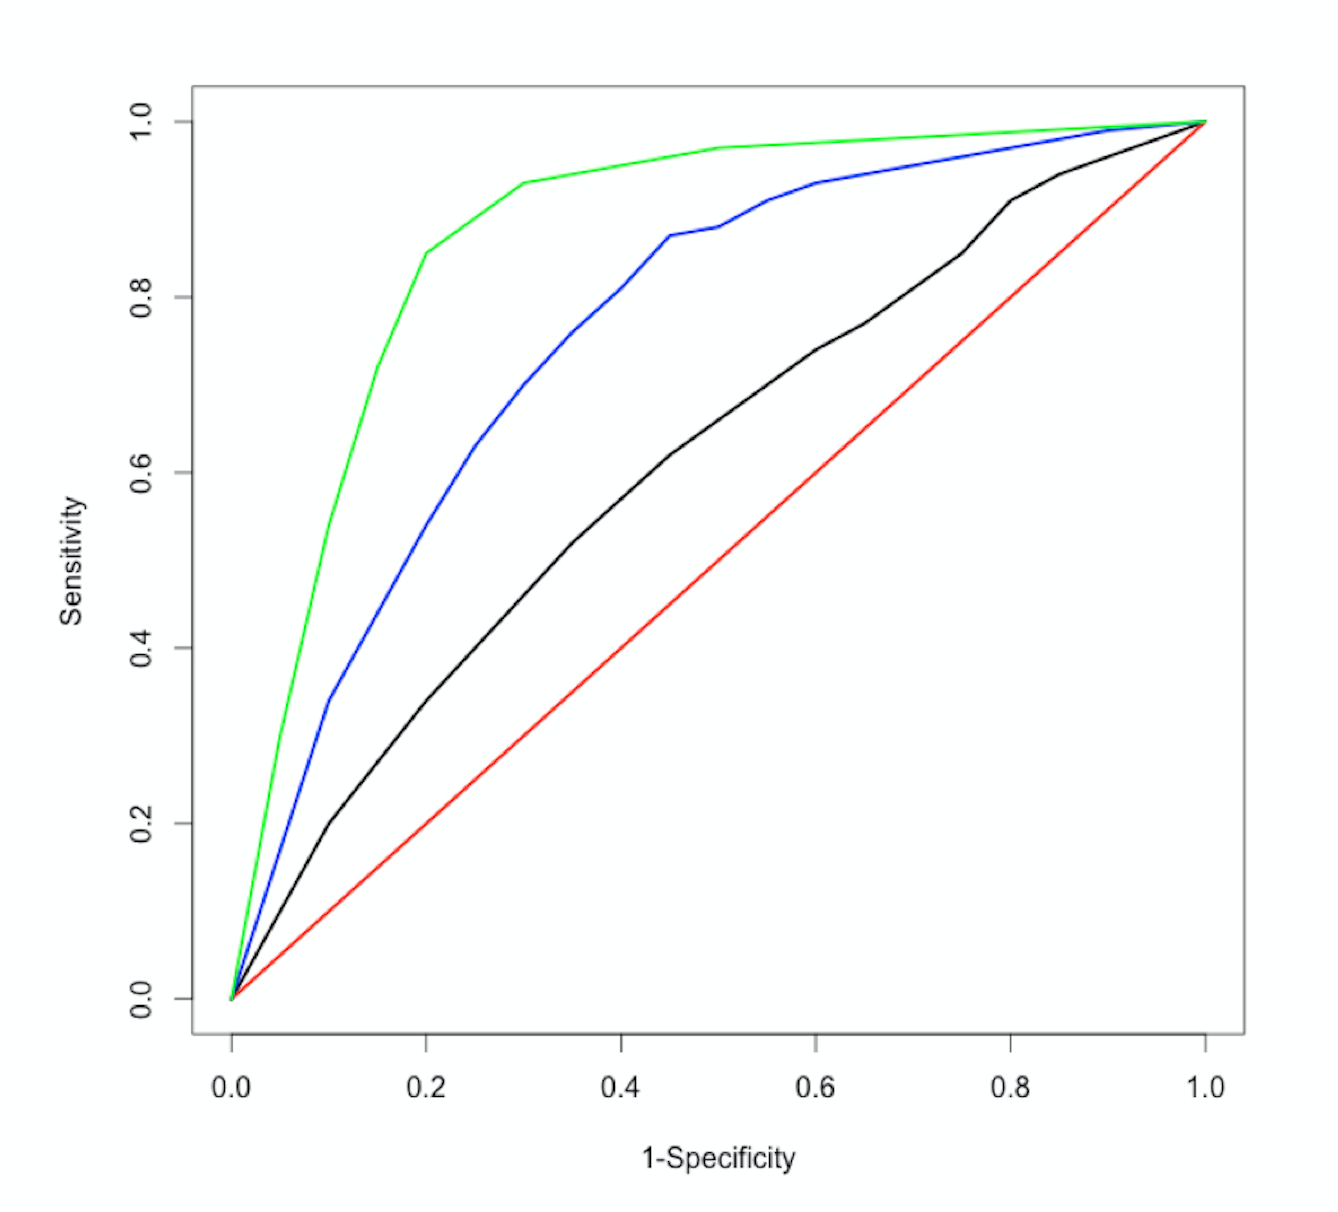
ROC曲線

2020-06-22 6.22.54 PMのスクリーンショット.png

$$

$\text{Sensitivity} = \frac{TP}{TP + FN}$

$\text{Specificity} = \frac{TN}{TN + FP}$

R で学ぶクレジットリスク・モデリング

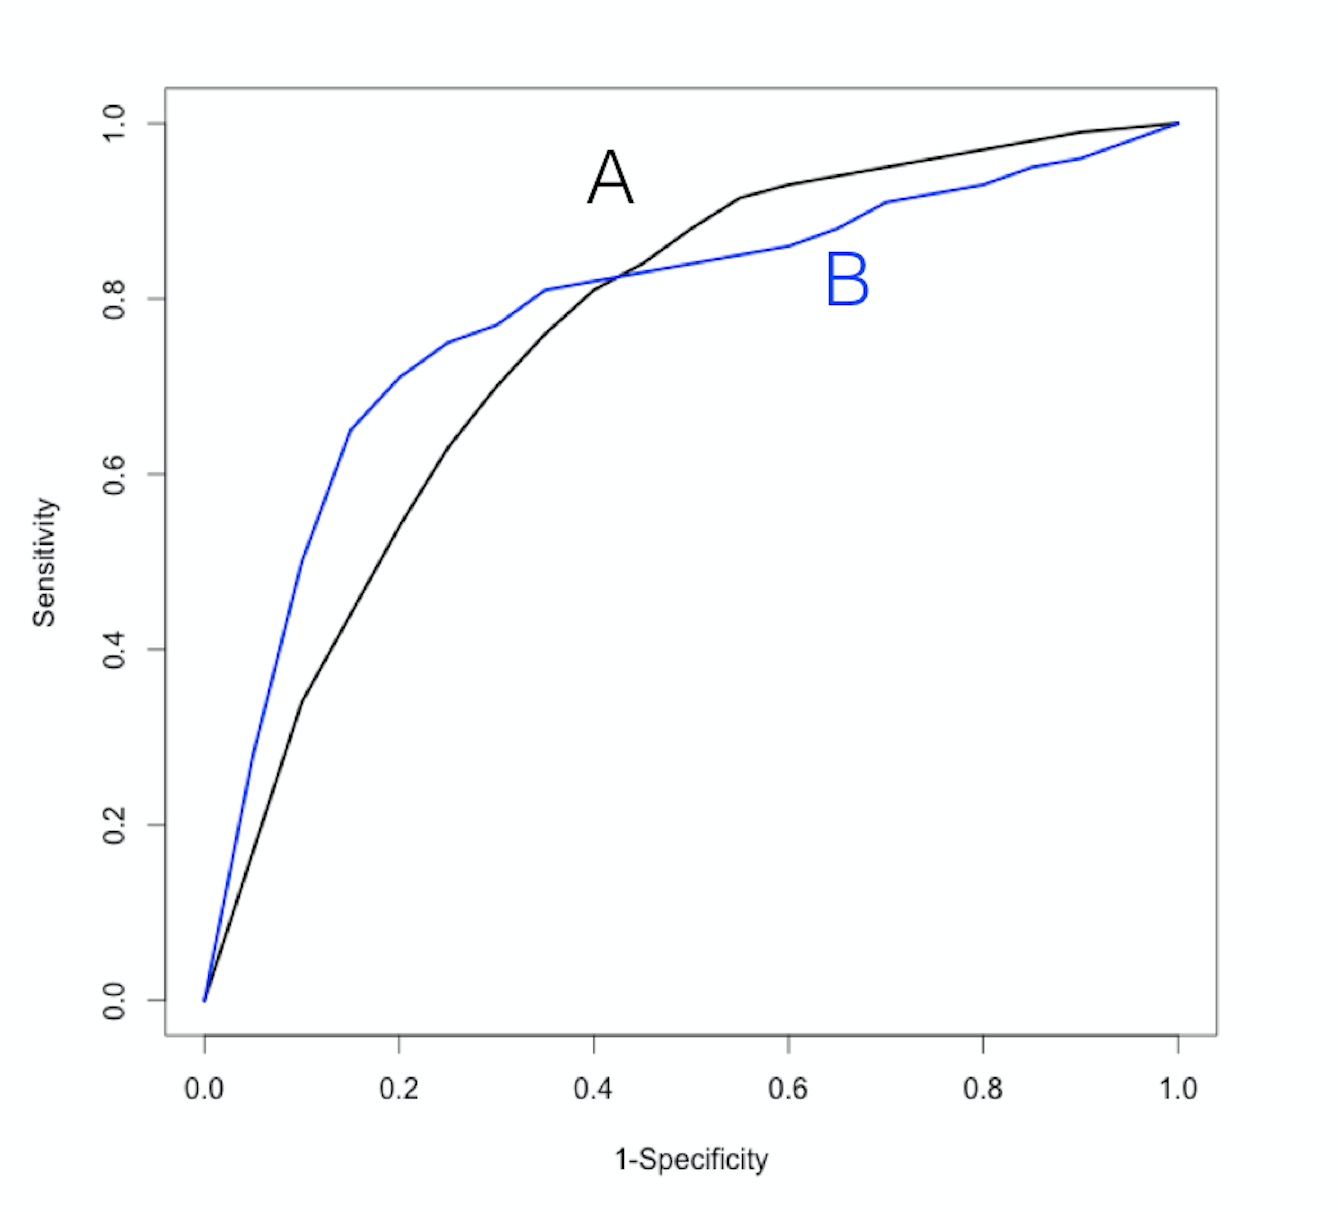
どちらが優れているか?

2020-06-22 6.23.06 PMのスクリーンショット.png

  • ROC曲線のAUC A = 0.75
  • ROC曲線のAUC B = 0.78
R で学ぶクレジットリスク・モデリング

Let's practice!

R で学ぶクレジットリスク・モデリング

Preparing Video For Download...