# Convert TDM to matrix
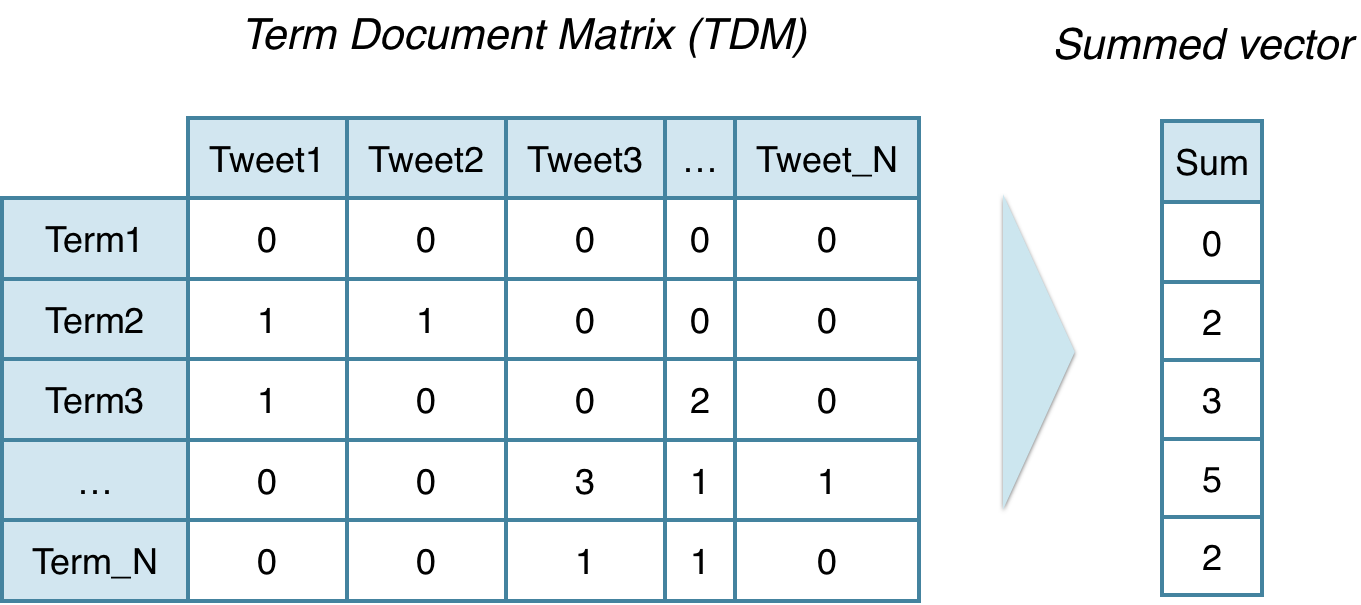
coffee_m <- as.matrix(coffee_tdm)

# Sum rows and sort by frequency
term_frequency <- rowSums(coffee_m)
term_frequency <- sort(term_frequency,
                       decreasing = TRUE)

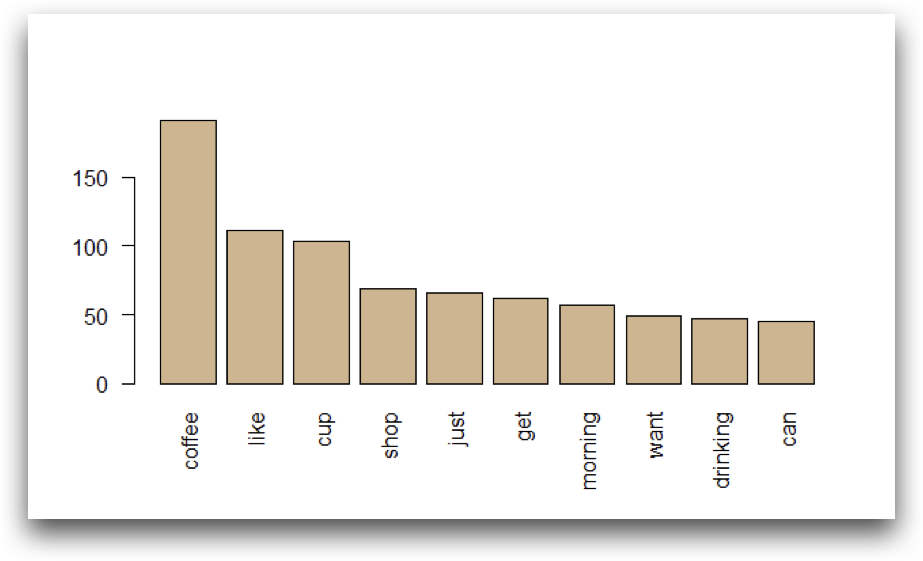
# Create a barplot
barplot(term_frequency[1:10],
        col = "tan",
        las = 2)
qdap による出現頻度プロット
# Load qdap package
library(qdap)

# Find term frequencies
frequency <- freq_terms(
    tweets$text,
    top = 10,
    at.least = 3,
    stopwords = "Top200Words"
  )

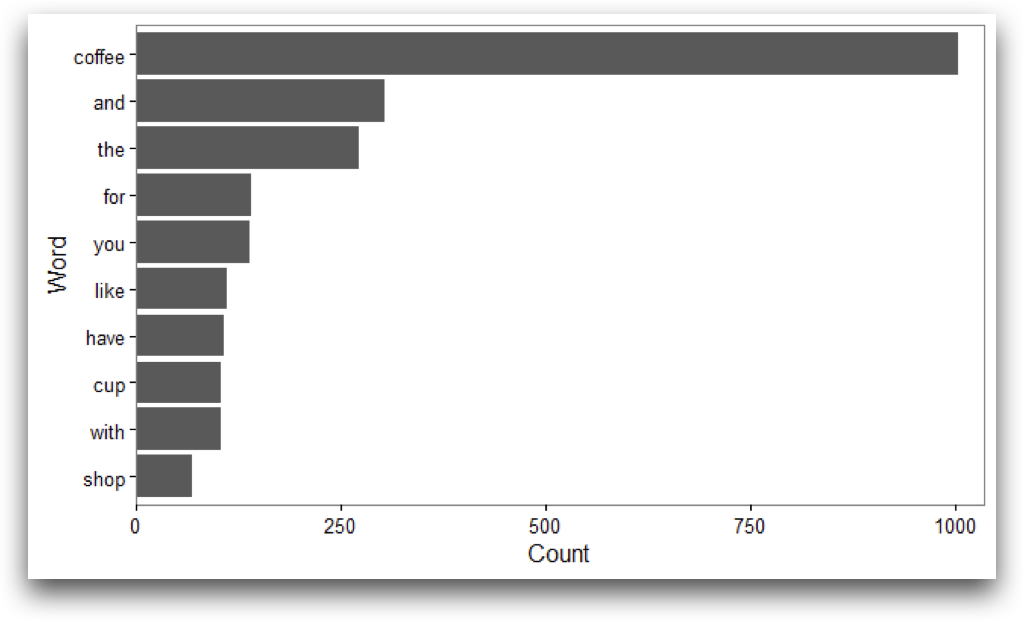
# Plot term frequencies
plot(frequency)