適合度向上のための負荷量追加
Rで学ぶ因子分析

Jennifer Brussow
Psychometrician
調整が必要な場合
復習:
- EFAはすべての項目/因子の負荷量を推定する
- CFAは指定された負荷量のみ推定する
- 適合度の低さは、除外された負荷量が原因の可能性がある
構文への負荷量の追加
追加すべき項目/因子の関係(2つ):
- 外向性 → 項目 N4
- 神経症傾向 → 項目 E3
summary(theory_CFA)
...

Parameter Estimates
            Estimate   Std Error  z value    Pr(>|z|)
C[EXT,NEU]   0.2362614 0.03364096   7.023029  2.171093e-12 NEU <--> EXT
...
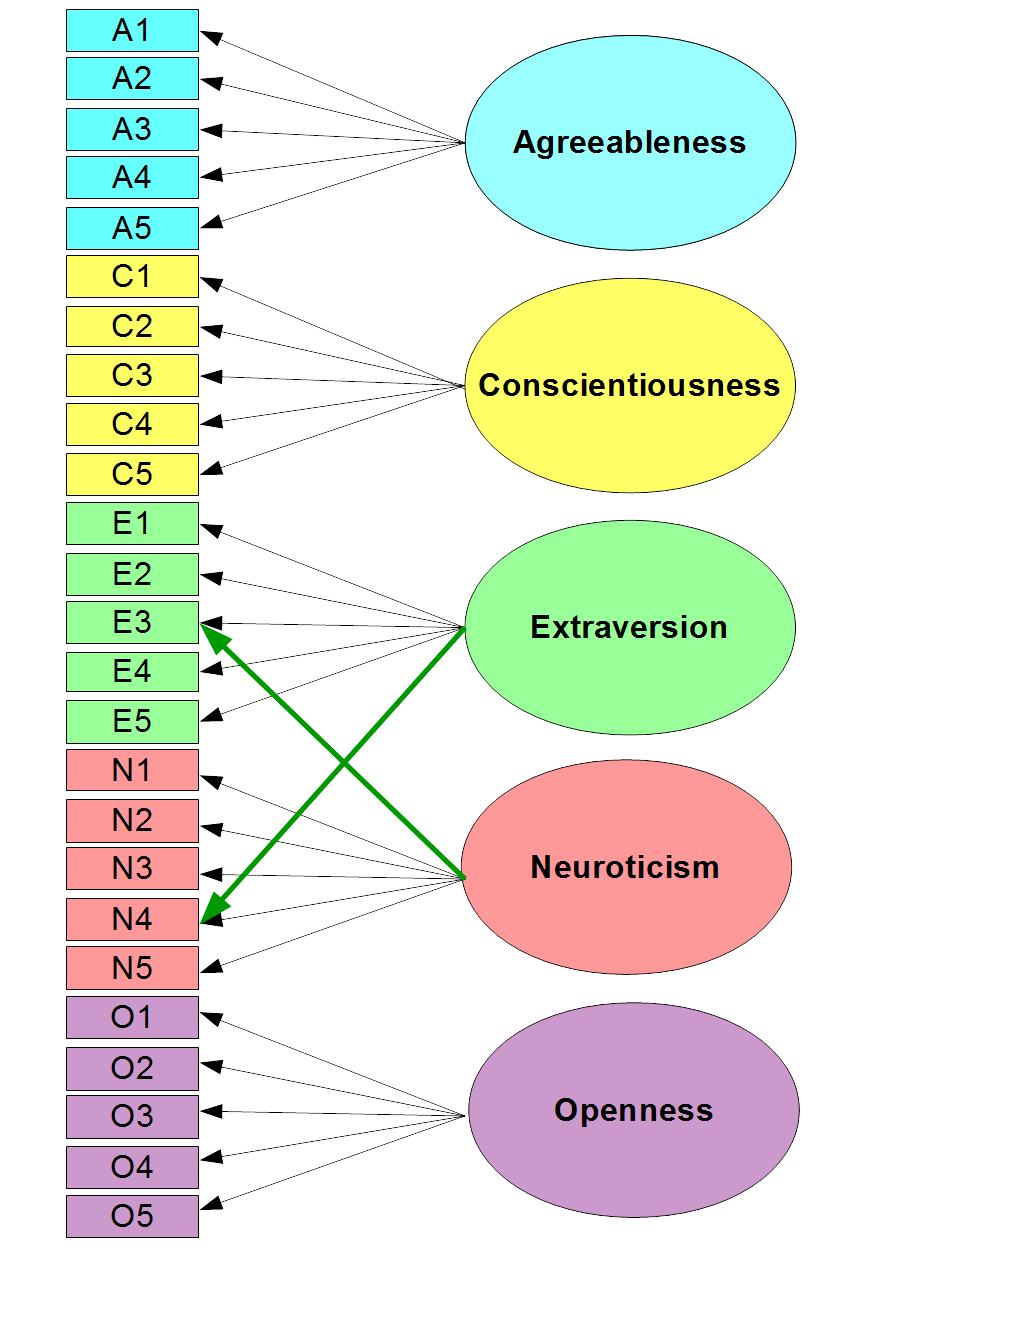
構文への新しい負荷量の追加
# Add some plausible item/factor loadings to the syntax theory_syn_add <- " AGE: A1, A2, A3, A4, A5 CON: C1, C2, C3, C4, C5 EXT: E1, E2, E3, E4, E5, N4 NEU: N1, N2, N3, N4, N5, E3 OPE: O1, O2, O3, O4, O5 "# As before, convert your equations to sem-compatible syntax theory_syn2 <- cfa(text = theory_syn_add, reference.indicators = FALSE)# Run a CFA with the revised syntax theory_CFA_add <- sem(model = theory_syn2, data = bfi_CFA)
元モデルと改訂モデルの比較
# Conduct a likelihood ratio test
anova(theory_CFA, theory_CFA_add)
LR Test for Difference Between Models

               Model Df Model Chisq Df LR Chisq Pr(>Chisq)
theory_CFA          265      2212.0
theory_CFA_rev      263      2097.8  2   114.28  < 2.2e-16 ***

Signif. codes:  0 '***' 0.001 '**' 0.01 '*' 0.05 '.' 0.1 ' ' 1
元モデルと改訂モデルの比較
# Compare the comparative fit indices - higher is better!
summary(theory_CFA)$CFI
0.785075
summary(theory_CFA_add)$CFI
0.7974694
元モデルと改訂モデルの比較
# Compare the RMSEA values - lower is better!
summary(theory_CFA)$RMSEA
0.07731925 NA NA 0.90
summary(theory_CFA_add)$RMSEA
0.07534156 NA NA 0.90
- 適合度指標の詳細: http://davidakenny.net/cm/fit.htm
練習しましょう!
Rで学ぶ因子分析

