pandasで直接プロットする

R ユーザーのための Python

Daniel Chen

Instructor

Pythonでのプロット

  • データのパターンを素早く可視化
  • Pythonのプロットライブラリ:
    • pandas
    • Seaborn
    • Matplotlib
R ユーザーのための Python

pandasのplotメソッド

  • plot() メソッド
  • pandasのDataFrameおよびSeriesオブジェクトに使用可能
  • plot に kind 引数を渡す
  • kind の種類:
    • line : 折れ線グラフ(デフォルト)
    • bar : 縦棒グラフ
    • barh : 横棒グラフ
  • hist : ヒストグラム
  • box : 箱ひげ図
  • kde : カーネル密度推定プロット
  • density : 'kde' と同じ
  • area : 面積グラフ
  • pie : 円グラフ
  • scatter : 散布図
  • hexbin : 六角形ビンプロット
R ユーザーのための Python

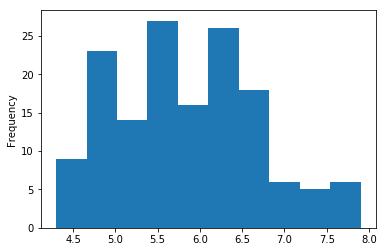
一変量:ヒストグラム

import matplotlib.pyplot as plt
iris['sepal_length'].plot(kind='hist')
plt.show()
R ユーザーのための Python

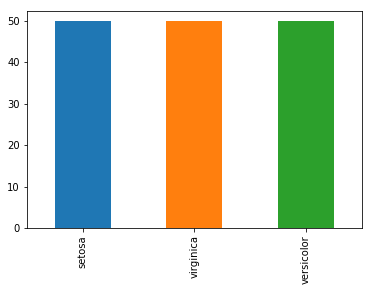
一変量:棒グラフ

cts = iris['species'].value_counts()
cts.plot(kind='bar')
plt.show()
R ユーザーのための Python

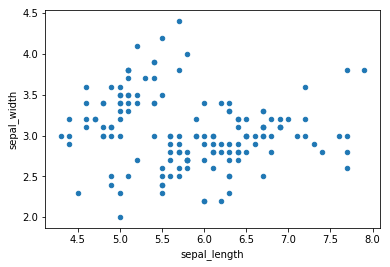
二変量:散布図

iris.plot(kind='scatter', x='Sepal.Length', y='Sepal.Width')
plt.show()
R ユーザーのための Python

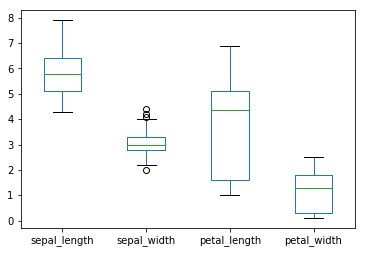
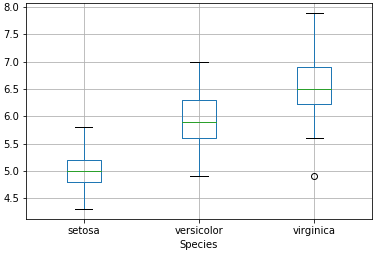
二変量:箱ひげ図

iris.plot(kind='box')
plt.show()
R ユーザーのための Python

二変量:箱ひげ図

iris.boxplot(by='Species', column='Sepal.Length')
plt.show()
R ユーザーのための Python

練習しましょう!

R ユーザーのための Python

Preparing Video For Download...