Pythonで学ぶ米国センサスデータ分析
Lee Hachadoorian
Asst. Professor of Instruction, Temple University
通勤の対象
通勤の地理単位

表 B08519:就業地ベース 過去12か月の労働者所得(2017年インフレ調整ドル)別・通勤手段
Total
$1 to $9,999 or loss
$10,000 to $14,999
$15,000 to $24,999
$25,000 to $34,999
$35,000 to $49,999
$50,000 to $64,999
$65,000 to $74,999
$75,000 or more
Car truck or van - drove alone
<repeat income categories>
Car truck or van - carpooled
<repeat income categories>
Public transportation (excluding taxicab)
<repeat income categories>
etc...
print(r.json())
[['B08519_011E', 'B08519_012E', 'B08519_013E', 'B08519_014E', 'B08519_015E',
'B08519_016E', 'B08519_017E', 'B08519_018E', 'B08519_020E', 'B08519_021E',
...
'B08519_061E', 'B08519_062E', 'B08519_063E', 'state', 'county'],
['10927', '9172', '19659', '22110', '32287',
'32977', '15693', '106972', '3663', '2518',
...
'7457', '2664', '20684', '36', '061']]
# Read data row into list data_row = r.json()[1][:-2]# Break data row into list of lists iter_len = 8 data = [data_row[i:i+iter_len] for i in range(0, len(data_row), iter_len)]print(data)
[['10927', '9172', '19659', '22110', '32287', '32977', '15693', '106972'],
['3663', '2518', '5484', '5625', '8028', '7990', '3369', '22958'],
['139358', '97178', '200514', '184510', '255491', '240973', '116673', '700808'],
['16743', '9117', '15900', '13710', '17442', '20206', '10370', '85879'], ...]
# Define row names and column names modes = ["drove_alone", "carpooled", "public", "walked", "taxi", "worked_at_home"]incomes = ["0k", "10k", "15k", "25k", "35k", "50k", "65k", "75k"]# Create DataFrame manhattan = pd.DataFrame(data=data, index=modes, columns=incomes) manhattan = manhattan.astype(int)
print(manhattan)
0k 10k 15k ... 50k 65k 75k
drove_alone 10716 8965 19294 ... 31502 15519 104078
carpooled 3740 2451 5852 ... 7994 3438 22625
public 140957 99474 197241 ... 235158 111959 654800
walked 16795 9045 15451 ... 20704 10663 83681
taxi 3201 2209 4515 ... 6551 3029 35572
worked_at_home 6854 3885 5489 ... 7776 2809 19598
[6 rows x 8 columns]
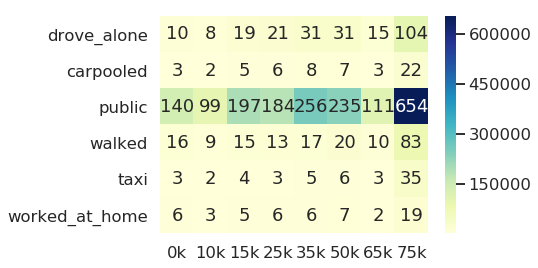
# Create heatmap of commuters by mode by income
sns.heatmap(manhattan, annot=manhattan // 1000, fmt="d", cmap="YlGnBu")
Pythonで学ぶ米国センサスデータ分析