語彙スコアと自己申告による社会階級
R による数値データの推測

Mine Cetinkaya-Rundel
Associate Professor of the Practice, Duke University
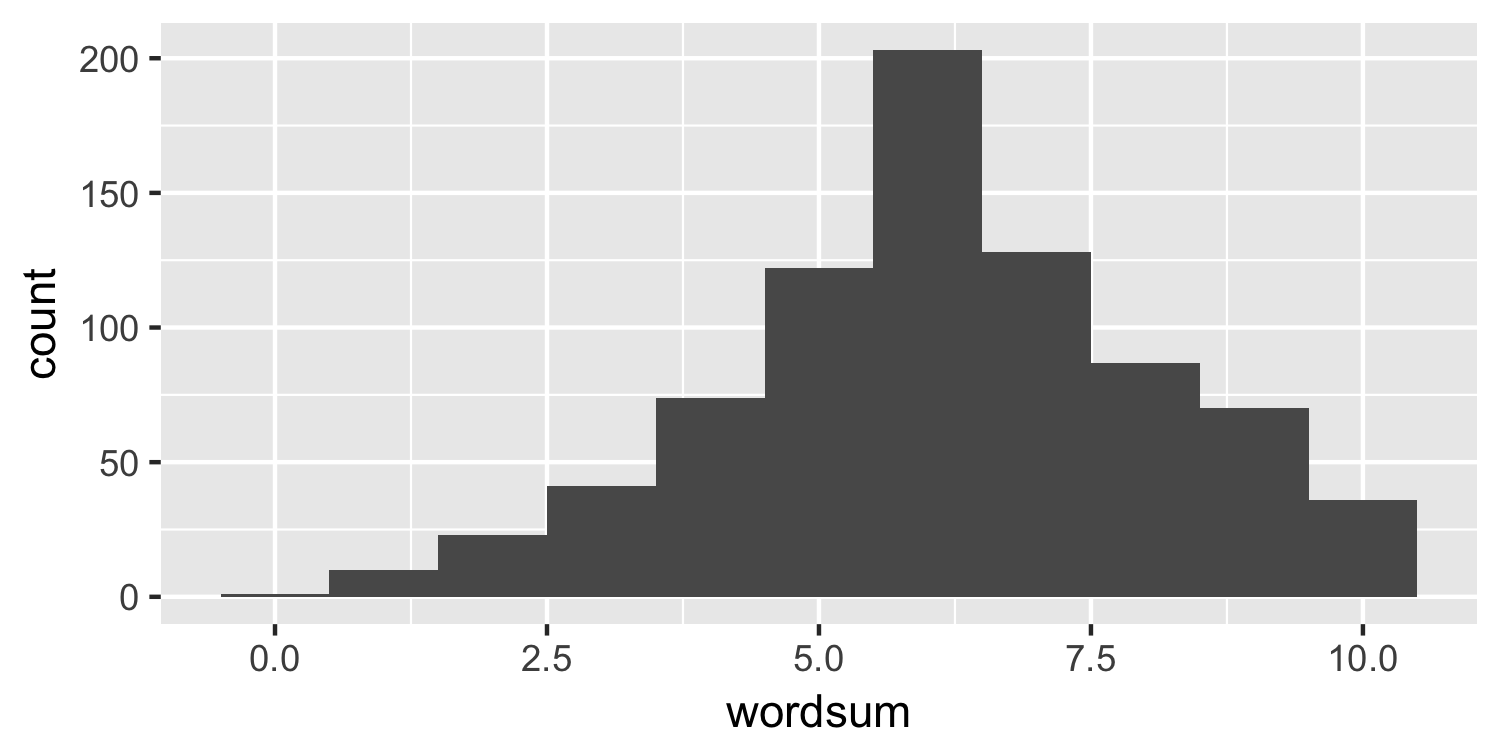
語彙スコアの分布
ggplot(data = gss, aes(x = wordsum)) +
  geom_histogram(binwidth = 1)
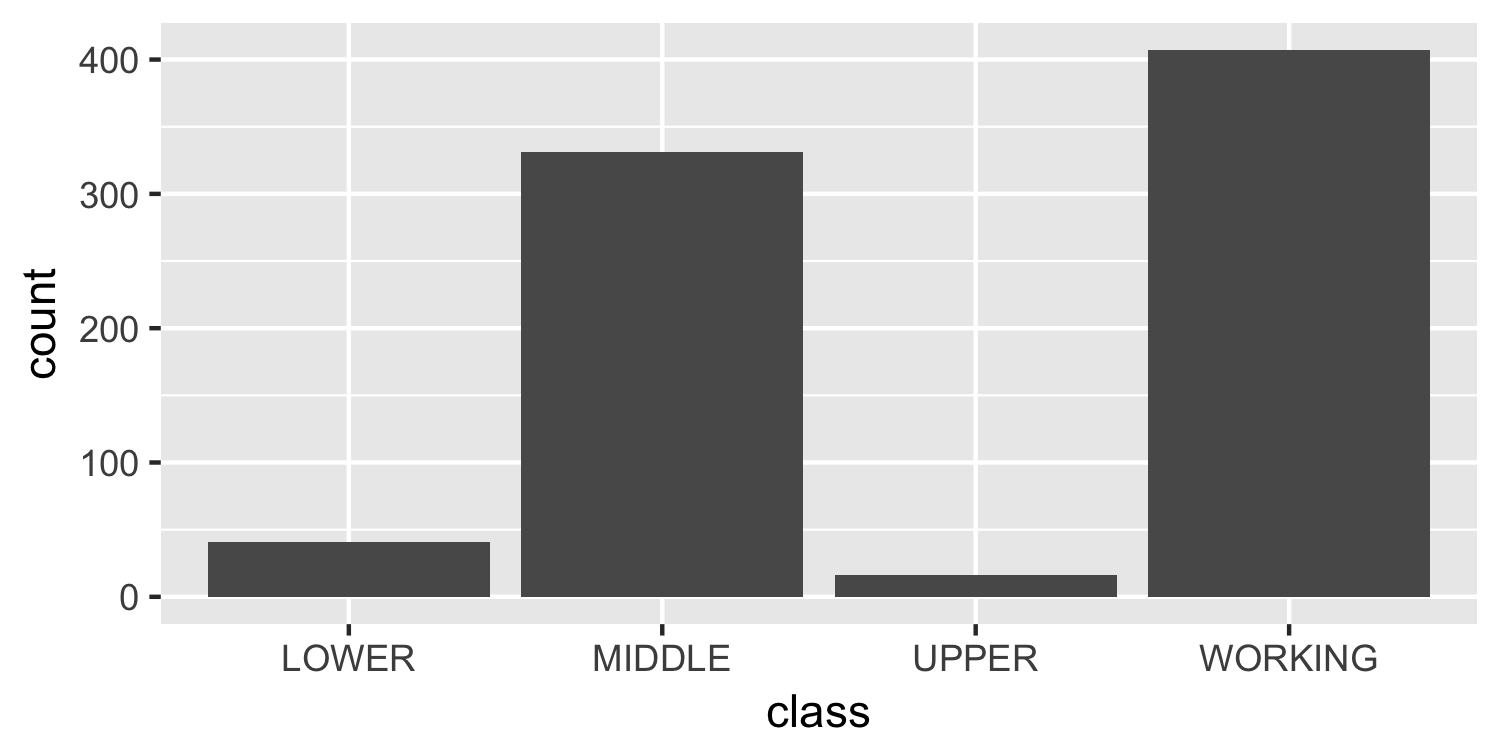
自己申告による社会階級: `class`
R による数値データの推測
Mine Cetinkaya-Rundel
Associate Professor of the Practice, Duke University
ggplot(data = gss, aes(x = wordsum)) +
  geom_histogram(binwidth = 1)

