コースへようこそ!
R による数値データの推測

Mine Cetinkaya-Rundel
Associate Professor of the Practice, Duke University
マンハッタンの家賃
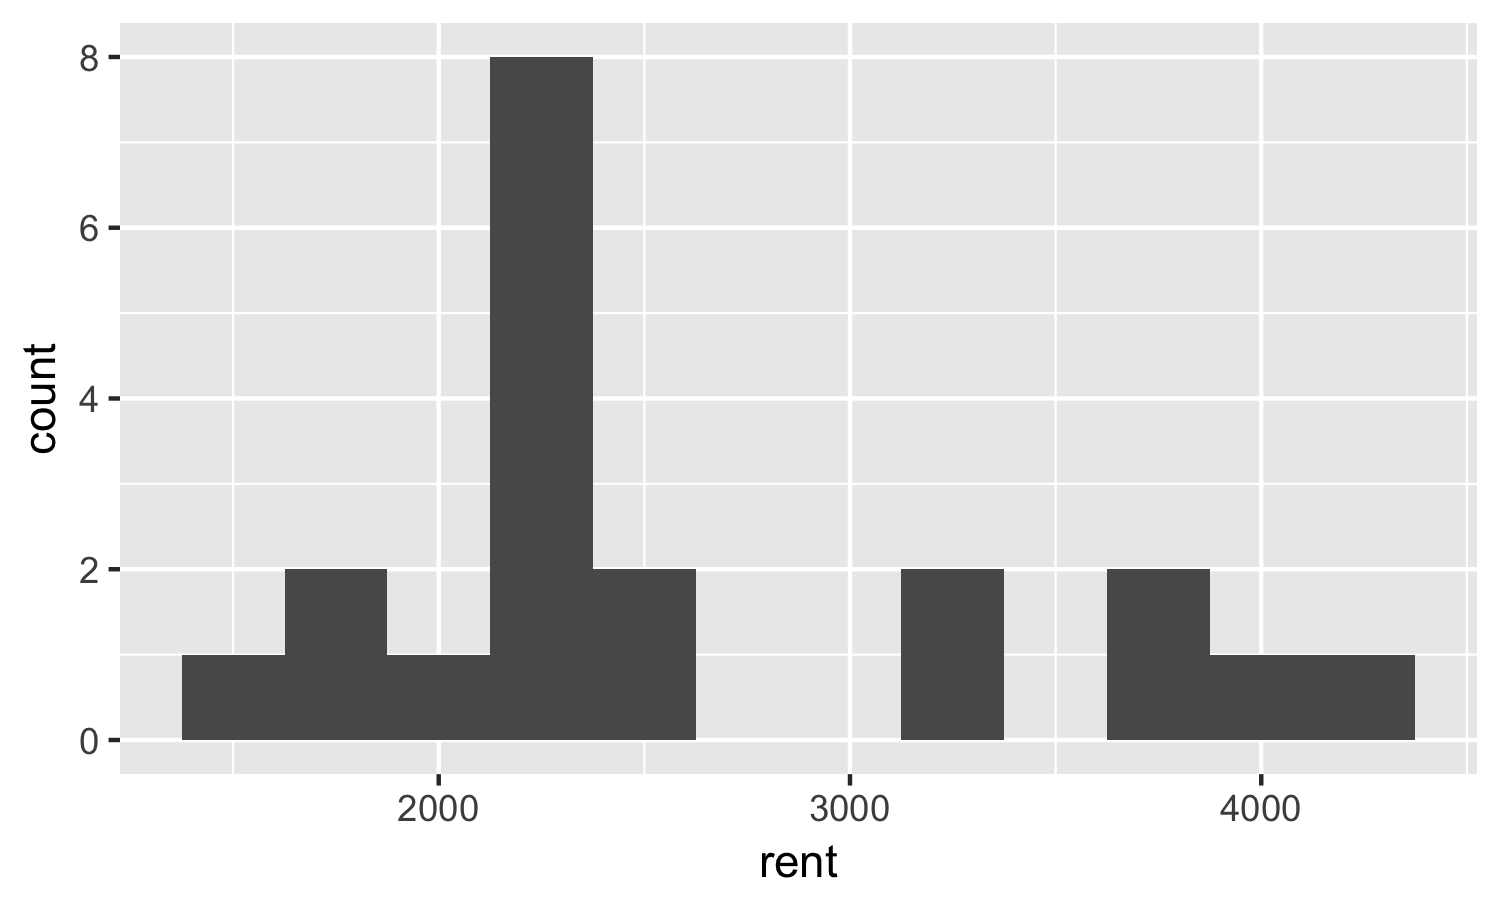
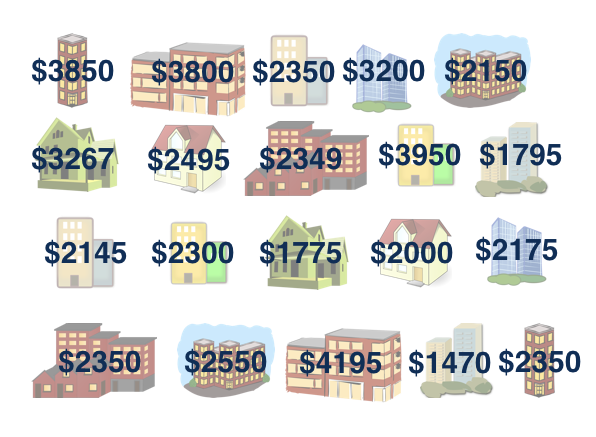
観測サンプル
標本中央値 = $2,350
ブートストラップ母集団
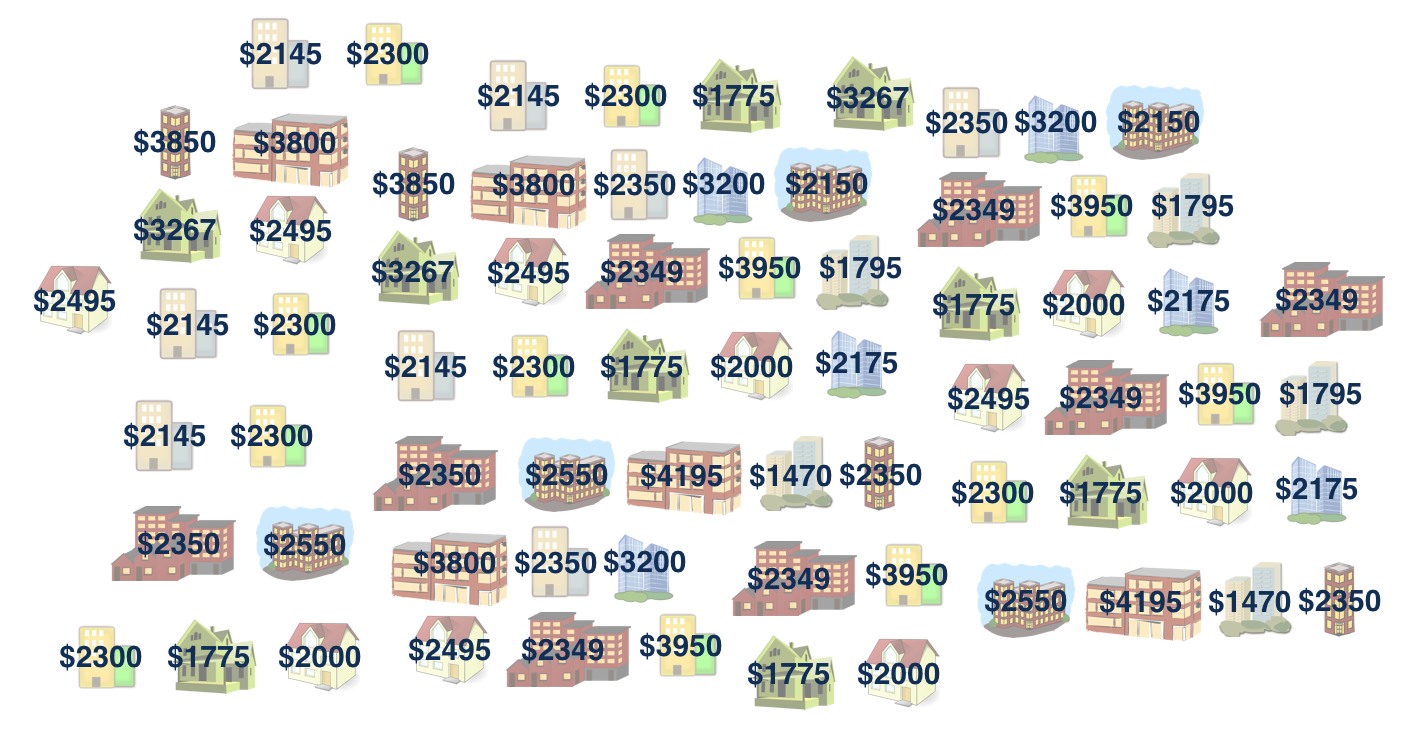
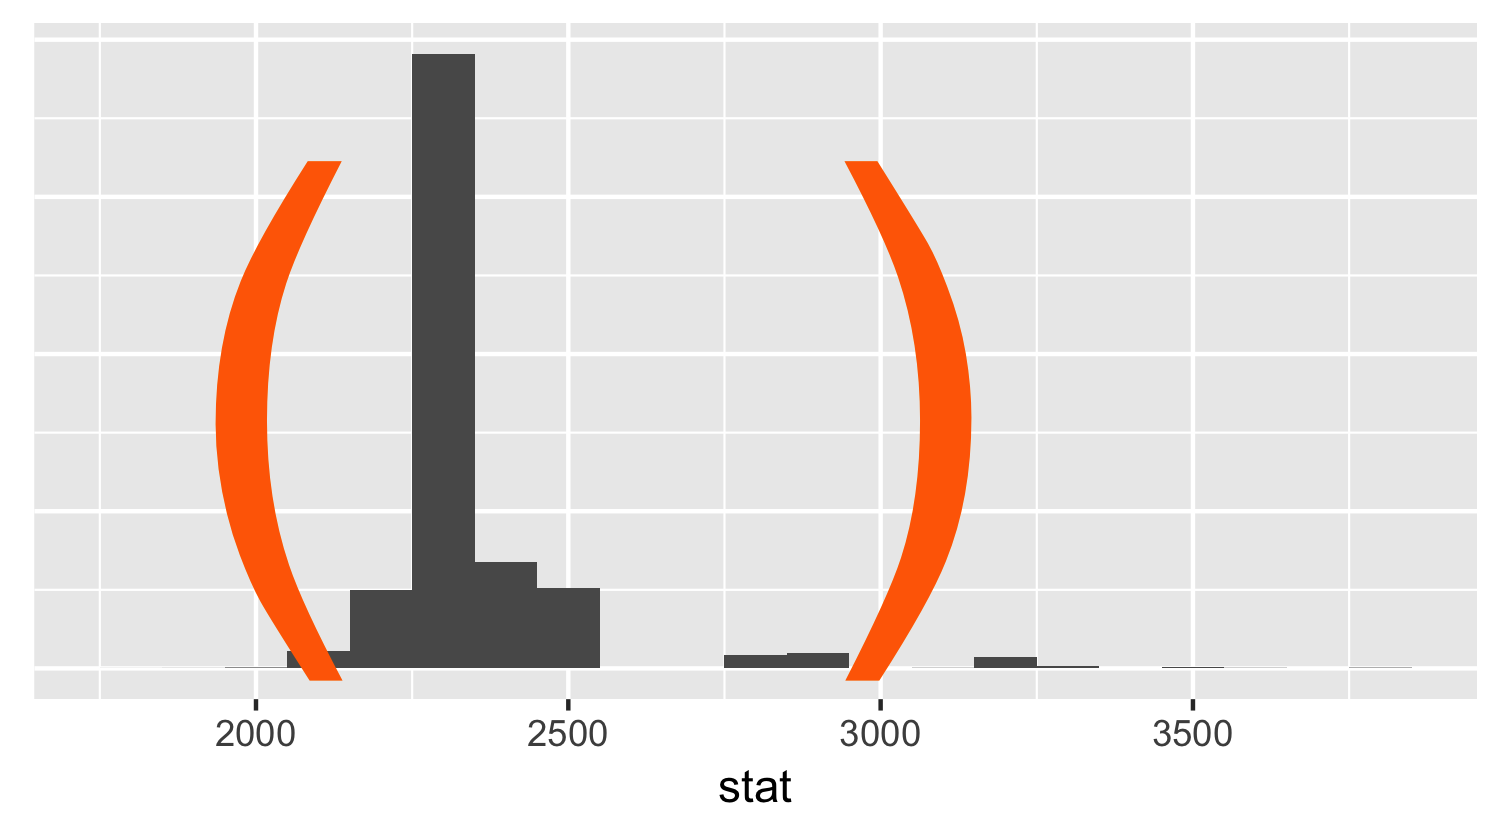
ブートストラップ区間の構築
library(infer)

___ %>%                               # start with data frame
  specify(response = ___) %>%         # specify the variable of interest
generate(reps = ___, type = "bootstrap") %>% # generate bootstrap samples
calculate(stat = "___") # calculate bootstrap statistic
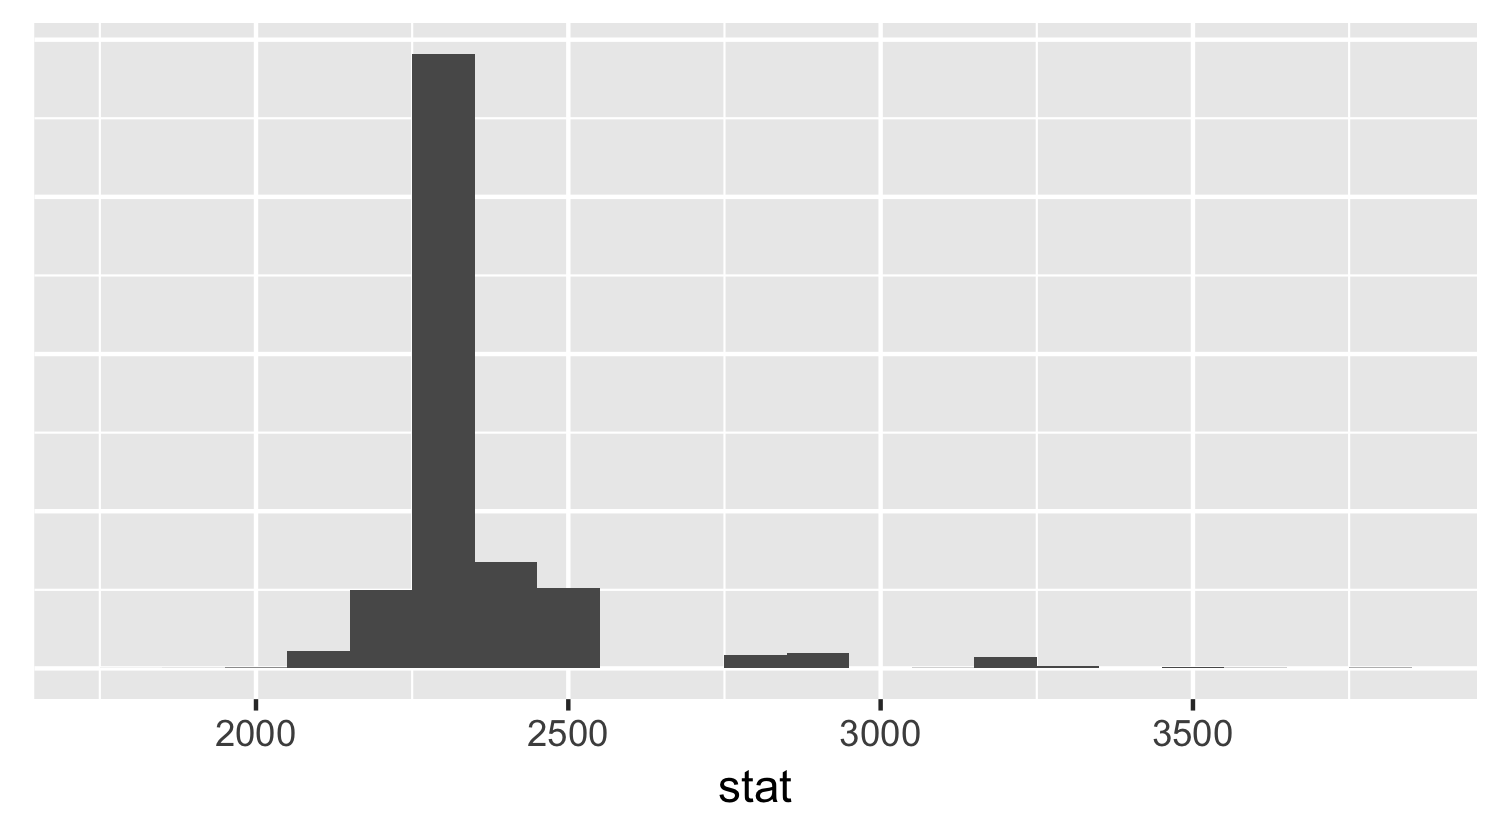
ブートストラップ区間の構築
library(infer)

___ %>%                               # start with data frame
  specify(response = ___) %>%         # specify the variable of interest
  generate(reps = ___, type = "bootstrap") %>%  # generate bootstrap samples
calculate(stat = "___") # calculate bootstrap statistic