検証済みGARCHモデルを本番運用する

Rで学ぶGARCHモデル

Kris Boudt

Professor of finance and econometrics

本番での利用
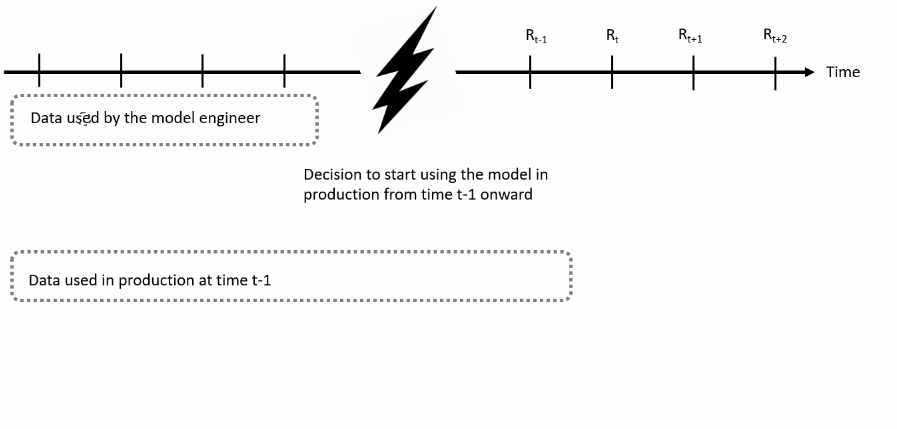
年ごとの日次リターンの分布

Rで学ぶGARCHモデル

新機能

  • ugarchfilter()で直近の平均とボラティリティの動学を分析
  • 予測にはugarchforecast()をugarchspec(ugarchfit()ではなく)に適用
Rで学ぶGARCHモデル

MSFTリターンの例

  • msftret: 1999〜2017の営業日リターン。
  • モデル当てはめは2010年末までのリターンで実施したとします。
  • 2017年末にこのモデルで過去のボラティリティ動学を分析し、将来のボラティリティを予測します。
Rで学ぶGARCHモデル

手順1:最終モデル仕様を定義

2010年末時点のmsftretで最良モデルを当てはめます。

# Specify AR(1)-GJR GARCH model with skewed student t distribution
garchspec <- ugarchspec(mean.model = list(armaOrder = c(1,0)),
 variance.model = list(model = "gjrGARCH"), distribution.model = "sstd")
# Estimate the model
garchfit <- ugarchfit(data = msftret["/2010-12"], spec = garchspec)

本番用仕様progarchspecを定義し、setfixed(progarchspec) <- as.list(coef(garchfit))を実行します。

progarchspec <- garchspec
setfixed(progarchspec) <- as.list(coef(garchfit))
Rで学ぶGARCHモデル

手順2:平均とボラティリティ動学の分析

ugarchfilter()を使用します。

garchfilter <- ugarchfilter(data = msftret, spec = progarchspec)
plot(sigma(garchfilter))                                
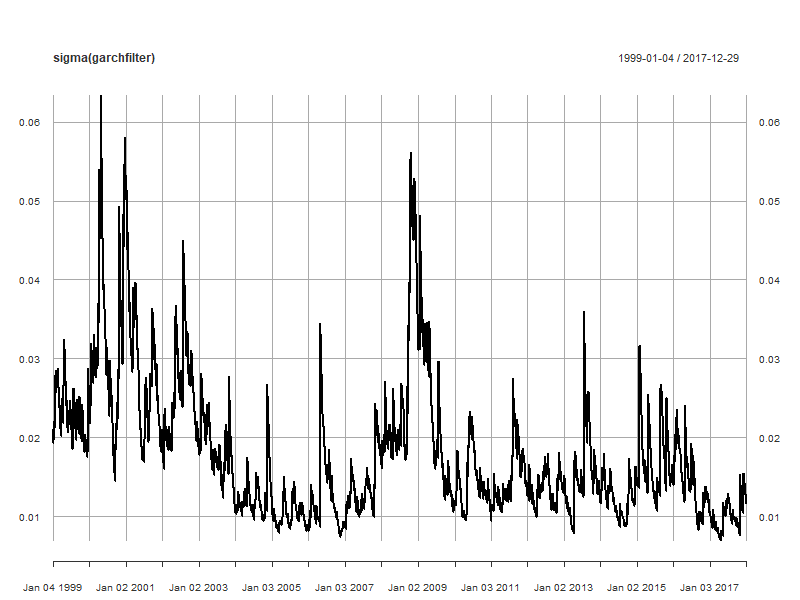
年ごとの日次リターンの分布

Rで学ぶGARCHモデル

手順3:将来リターンを予測する

garchforecast <- ugarchforecast(data = msftret,
                                fitORspec = progarchspec, 
                                n.ahead = 10) # Make predictions for next ten days
cbind(fitted(garchforecast), sigma(garchforecast))
       2017-12-29 2017-12-29
T+1  0.0004781733 0.01124870
T+2  0.0003610470 0.01132550
T+3  0.0003663683 0.01140171
T+4  0.0003661265 0.01147733
T+5  0.0003661375 0.01155238
T+6  0.0003661370 0.01162688
T+7  0.0003661371 0.01170083
T+8  0.0003661371 0.01177424
T+9  0.0003661371 0.01184712
T+10 0.0003661371 0.01191948
Rで学ぶGARCHモデル

シミュレーションでの利用

観測リターンの分析に完全モデルを当てる代わりに、人工的な対数リターンをシミュレーションできます。

$$ r_{t} = \log(P_{t}) - \log(P_{t-1}) $$

将来リターンの不確実性と価格への影響を評価するのに有用です。将来価格は次の通り:

$$ P_{t + h} = P_{t} \exp(r_{t + 1} + r_{t + 2} + \ldots + r_{t + h}) $$

Rで学ぶGARCHモデル

手順1:シミュレーションモデルを較正する

推定には対数リターンを使用します。

# Compute log returns
msftlogret <- diff(log(MSFTprice))[-1]

モデルを推定し、その推定値をシミュレーションモデルに設定します。

garchspec <- ugarchspec(mean.model = list(armaOrder = c(1, 0)),
                        variance.model = list(model = "gjrGARCH"),
                        distribution.model = "sstd")
# Estimate the model
garchfit <- ugarchfit(data = msftlogret, spec = garchspec)

# Set that estimated model as the model to be used in the simulation
simgarchspec <- garchspec
setfixed(simgarchspec) <- as.list(coef(garchfit))
Rで学ぶGARCHモデル

手順2:`ugarchpath()`でシミュレーションを実行

ugarchpath() によるシミュレーションでは次を指定します:

  • spec:完全に指定したGARCHモデル
  • m.sim:生成するシミュレーション系列の本数
  • n.sim:各系列の観測数(例:252)
  • rseed:乱数の種(再現性のため)
simgarch <- ugarchpath(spec = simgarchspec, m.sim = 4,
                       n.sim = 10 * 252, rseed = 12345)
Rで学ぶGARCHモデル

手順3:シミュレーションリターンの分析

fitted() でシミュレーションリターンを取得します。

simret <- fitted(simgarch)
plot.zoo(simret) 
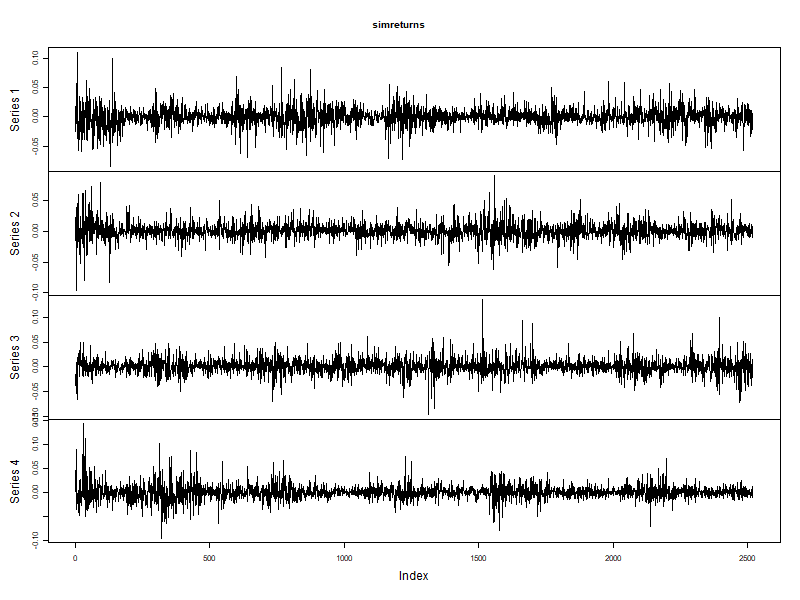
シミュレーションしたリターン

Rで学ぶGARCHモデル

シミュレーションボラティリティの分析

plot.zoo(sigma(simgarch))
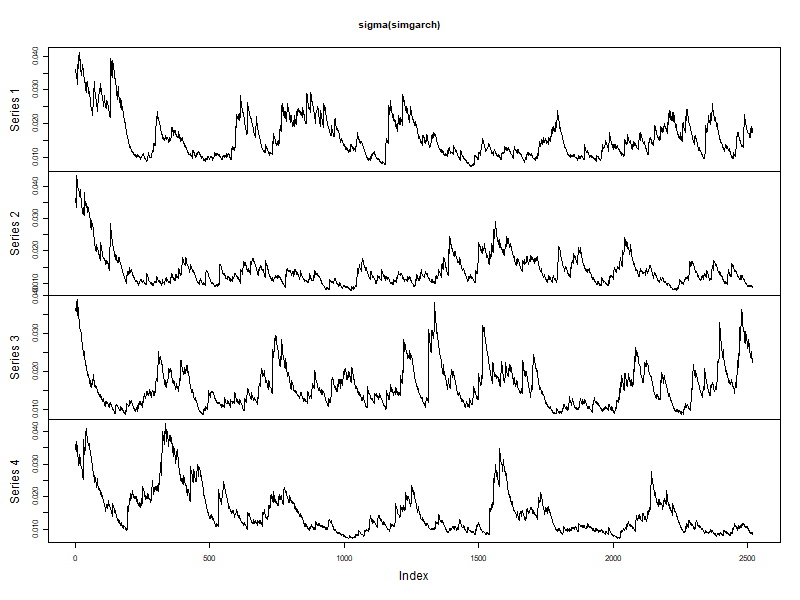
シミュレーションしたボラティリティ

Rで学ぶGARCHモデル

シミュレーション価格の分析

初期価格1として、株価の10年シミュレーションを4本描画します。

simprices <- exp(apply(simret, 2, "cumsum"))
matplot(simprices, type = "l", lwd = 3)
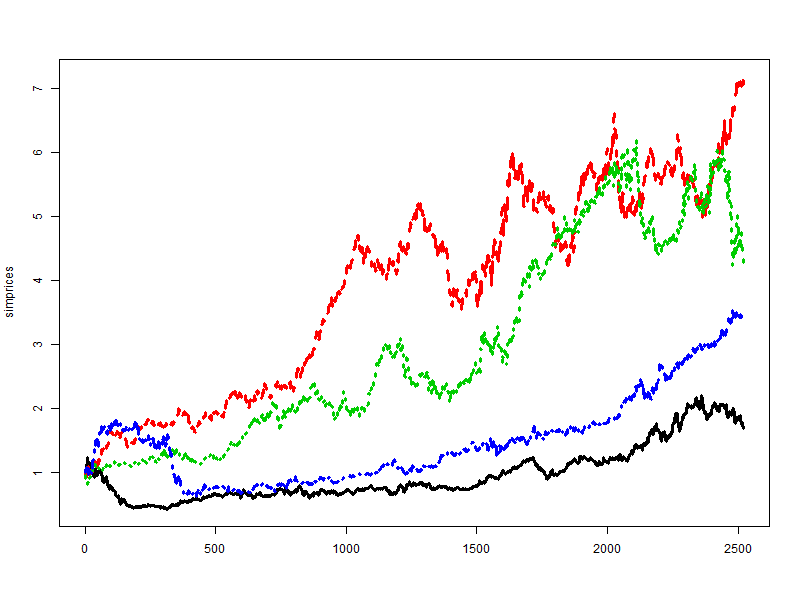
シミュレーションした価格

Rで学ぶGARCHモデル

setfixed(), ugarchfilter(), ugarchforecast(), ugarchpath()で演習の時間です

Rで学ぶGARCHモデル

Preparing Video For Download...