ピアソンの相関

Rで学ぶA/Bテスト

Lauryn Burleigh

Data Scientist

ピアソン相関の前提

  • 相関検定の選択:データの性質
  • ピアソンの相関
    • 線形
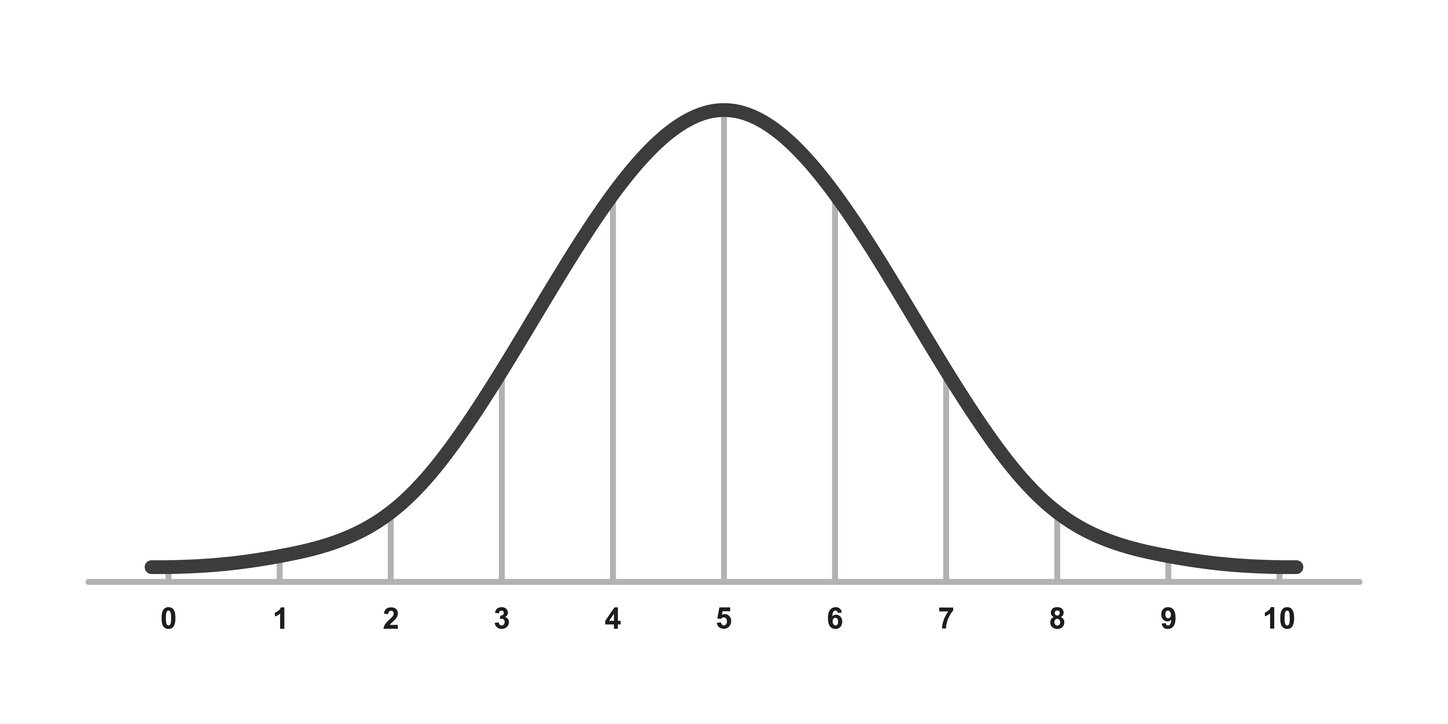
    • 正規分布

左下から右上に増加する直線。

標準正規分布のグラフ。

Rで学ぶA/Bテスト

ピアソン相関とA/Bテスト

  • グループA:チーズピザ
  • グループB:ペパロニピザ


  • 食べる時間と満足度の関係

群を無視

  • 帰無仮説:時間と満足度に関係はない

各群

  • 帰無仮説:チーズピザで時間と満足度に関係はない
  • 帰無仮説:ペパロニピザで時間と満足度に関係はない
Rで学ぶA/Bテスト

サンプルサイズの決定

  • r 期待効果(cor()で算出)
  • 帰無を棄却するsig.level
library(pwr)
pwr.r.test(r = 0.3, power = 0.80, 
           sig.level = 0.05)
    approximate correlation power 
 calculation (arctangh transformation) 

              n = 84.07364
              r = 0.3
      sig.level = 0.05
          power = 0.8
    alternative = two.sided
Rで学ぶA/Bテスト

線形性の評価

ggplot(pizza, aes(x = enjoyment, 
                  y = time)) + 
    geom_point()
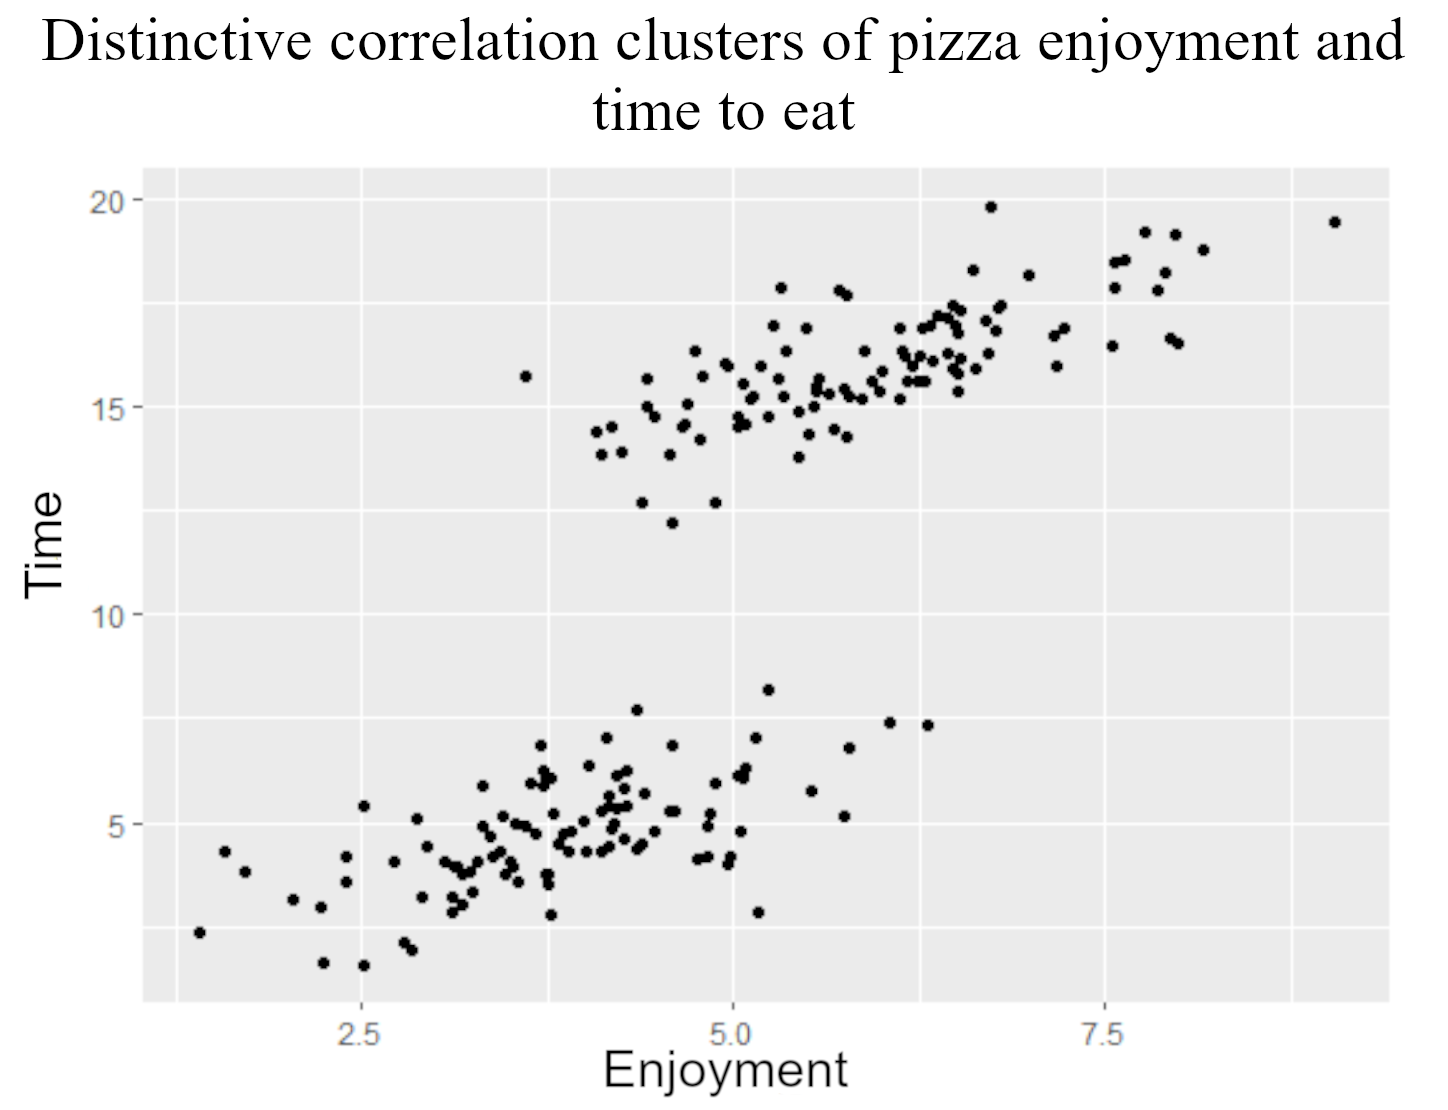
x軸に満足度、y軸に時間。正の線形関係の散布図。

ggplot(pizza, aes(x = enjoyment, 
                  y = time)) + 
    geom_point()

x軸に満足度、y軸に時間。左下のクラスタと右上の別クラスタがある正の線形関係の散布図。

Rで学ぶA/Bテスト

正規性の評価

shapiro.test(pizza$time)
    Shapiro-Wilk normality test
data:  pizza$time
W = 0.98686, p-value = 0.4282
  • データは正規的
shapiro.test(pizza$enjoyment)
    Shapiro-Wilk normality test
data:  pizza$enjoyment
W = 0.98916, p-value = 0.5971
  • データは正規的
Rで学ぶA/Bテスト

群を無視したピアソン

cor.test(~ time + enjoyment, 
         data = pizza, 
         method = "pearson")


分散の割合: cor^2

0.30^2
[1] 0.09
Pearson's product-moment correlation

data:  time and enjoyment
t = 22.304, df = 88, p-value = 0.0218
alternative hypothesis: true correlation
is not equal to 0
95 percent confidence interval:
 0.8833166 0.9479256
sample estimates:
      cor 
0.3021878
Rで学ぶA/Bテスト

群内のピアソン

cor.test(~ time + enjoyment, 
         data = pizza, 
         subset = 
             (Topping == "Cheese"),
         method = "pearson")
Pearson's product-moment correlation

data:  Time and Enjoy
t = 11.121, df = 98, p-value < 2.2e-16
alternative hypothesis: true correlation 
is not equal to 0
95 percent confidence interval:
 0.6451710 0.8226595
sample estimates:
     cor 
0.746935 
Rで学ぶA/Bテスト

検出力の分析

群を無視したピアソン:

Pearson's product-moment correlation

data:  time and enjoyment
t = 22.304, df = 88, p-value = 0.0218
alternative hypothesis: true 
correlation is not equal to 0
95 percent confidence interval:
 0.8833166 0.9479256
sample estimates:
      cor 
0.3021878
library(pwr)
pwr.r.test(r = 0.302, n = 100, 
           sig.level = 0.022)
     approximate correlation power 
  calculation (arctangh transformation) 

              n = 100
              r = 0.302
      sig.level = 0.022
          power = 0.7853514
    alternative = two.sided
Rで学ぶA/Bテスト

¡Vamos a practicar!

Rで学ぶA/Bテスト

Preparing Video For Download...