フィッシャーの正確確率検定
Rで学ぶA/Bテスト

Lauryn Burleigh
Data Scientist
前提条件
- カテゴリーデータのノンパラメトリック
- チーズかペパロニを再度食べるか
- 標本 < 1000
- 度数 < 5 が少なくとも20%
- 厳密なp値にはフィッシャーの正確検定
- 2x2度数表
超幾何分布
- 度数表の尤度
table(Pizza$Topping, Pizza$EatAgain)
              No Yes
  Cheese     140 360
  Pepperoni   80 420
仮説
- 帰無仮説:再度食べるかとトッピング群に関係はない
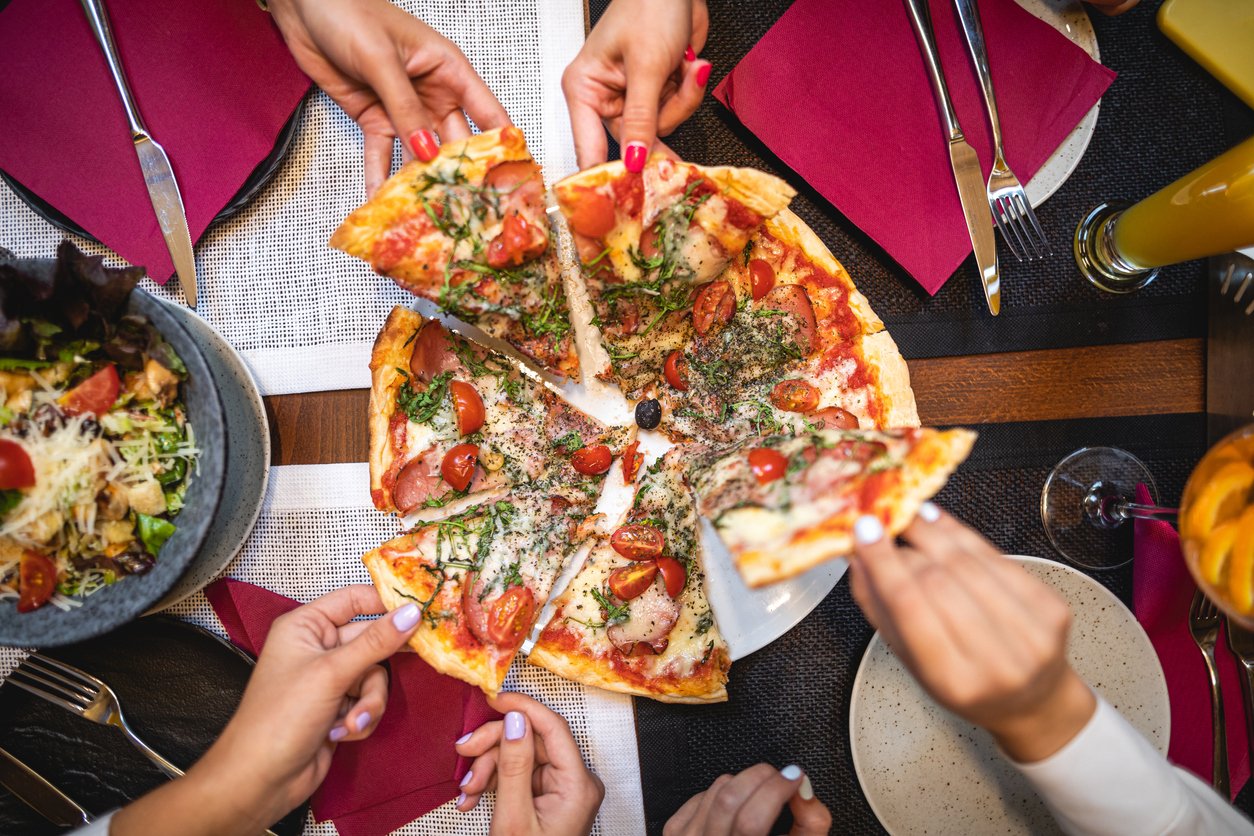
サンプル
library(pwr)
pwr.chisq.test(w = 0.1, df = 2,
               power = 0.80,
               sig.level = 0.05)
     Chi squared power calculation
              w = 0.1
              N = 963.4689
             df = 2
      sig.level = 0.05
          power = 0.8
NOTE: N is the number of observations
table(Pizza$Topping, Pizza$EatAgain)
              No Yes
  Cheese     140 360
  Pepperoni   80 420
検定
freqtbl <- table(Pizza$Topping,
                 Pizza$Time)
fisher.test(freqtbl)
    Fisher's Exact Test for Count Data
data:  freqtbl
p-value = 0.001809
alternative hypothesis: true odds ratio is not equal to 1
95 percent confidence interval:
 0.4569013 0.8417208
sample estimates:
odds ratio
 0.6209987
効果量
freqtbl <- table(Pizza$Topping,
                 Pizza$Time)
fisher.test(freqtbl)
- Small: 1.5
- Medium: 2.5
- Large: 4
- ペパロニはチーズの0.62倍
Fisher's Exact Test for Count Data
data:  freqtbl
p-value = 0.001809
alternative hypothesis: true odds
ratio is not equal to 1
95 percent confidence interval:
 0.4569013 0.8417208
sample estimates:
odds ratio
 0.6209987
検出力
library(pwr)
pwr.2p.test(h = 0.62, n = 500,
            sig.level = 0.002)
    Difference of proportion power
 calculation for binomial distribution

              h = 0.62
              n = 500
      sig.level = 0.002
          power = 1
    alternative = two.sided

NOTE: same sample sizes
Passons à la pratique !
Rで学ぶA/Bテスト

