スピアマン順位相関

Rで学ぶA/Bテスト

Lauryn Burleigh

Data Scientist

スピアマン相関の前提

  • 順位付け(位置で並べる)
  • スピアマン相関が高い=2変数の順位が類似
  • 連続または離散データ
    • 順序・間隔・比尺度

1が最も高く4が最も低い、4本の棒が高い順に並ぶ図。

Rで学ぶA/Bテスト

単調関係

  • スピアマン相関(rho):単調関係

    • 常に増加・減少とは限らない
  • 単調は線形より制約が緩い

ggplot(data, aes(x = drownings, 
                 y = icecream)) +
  geom_point()

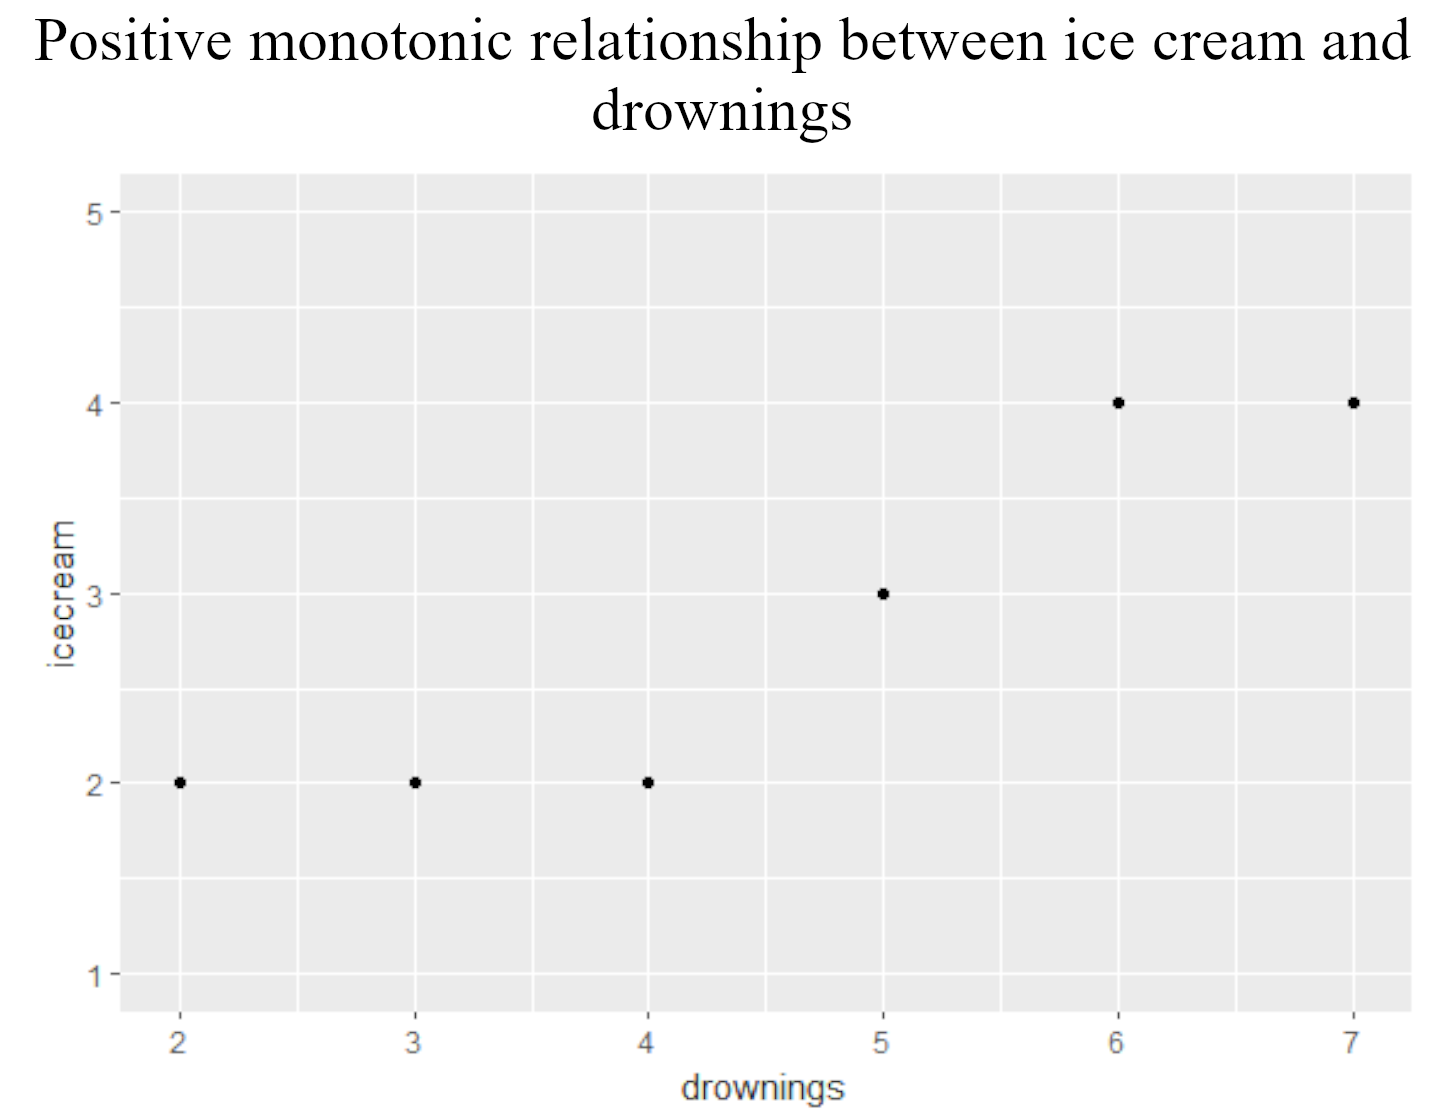
散布図。溺死が増えるにつれ、アイスはy軸で一定→上昇→一定と推移する単調増加。

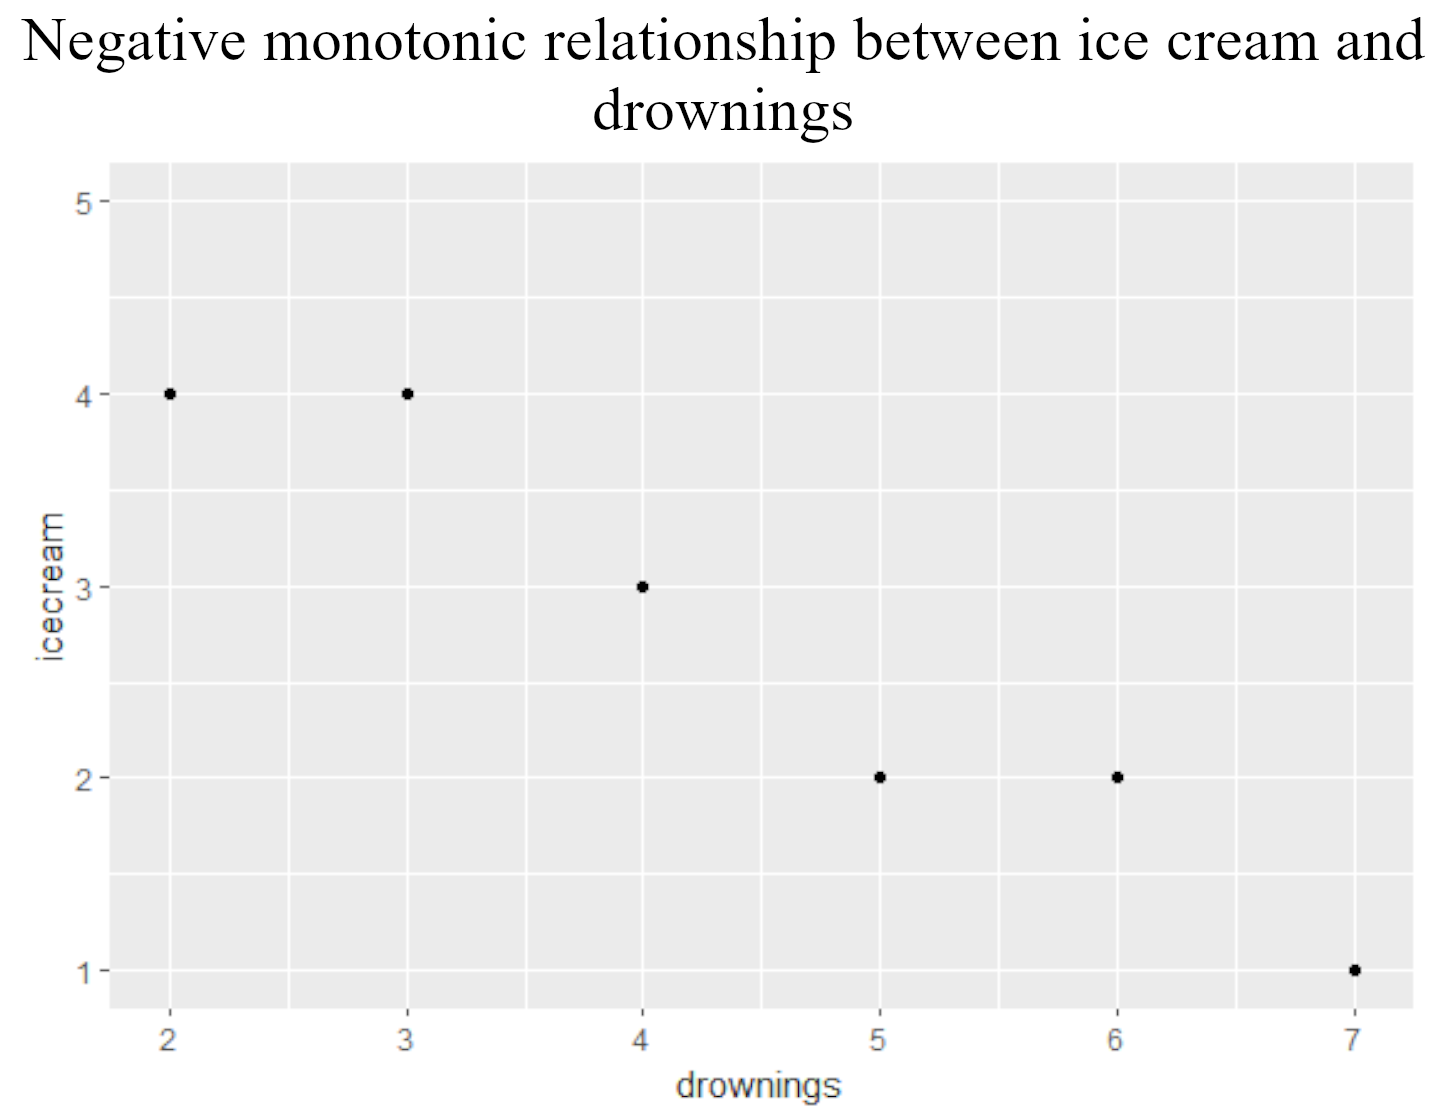
散布図。溺死が増えるにつれ、アイスはy軸で一定→低下→一定→低下と推移する単調減少。

Rで学ぶA/Bテスト

仮説とサンプルサイズ

  • 帰無仮説:ピザの時間と満足度に単調な関連はない
library(pwr)
pwr.r.test(r = 0.3, power = 0.80, 
           sig.level = 0.05)
    approximate correlation power 
 calculation (arctangh transformation) 

              n = 84.07364
              r = 0.3
      sig.level = 0.05
          power = 0.8
    alternative = two.sided
Rで学ぶA/Bテスト

グループ無視のスピアマン

cor.test(~ enjoyment + time, 
         data = pizza, 
         method = "spearman", 
        exact = FALSE)
    Spearman's rank correlation rho
data:  time and enjoyment
S = 2, p-value = .003245
alternative hypothesis: true rho is 
not equal to 0
sample estimates:
      rho 
0.9984962 
samp <- length(pizza$time)
[1]  90
Rで学ぶA/Bテスト

グループ内のスピアマン

cor.test(~ enjoyment + time, 
         data = pizza, 
         subset = 
             (Topping == "Cheese"),
         method = "spearman",
         exact = FALSE)
    Spearman's rank correlation rho
data:  time and enjoyment
S = 1.2434e-14, p-value = 0.0003968
alternative hypothesis: true rho is 
not equal to 0
sample estimates:
rho 
  1 
ggplot(pizza, aes(x = enjoyment, 
                  y = time, 
                  color = Topping)) + 
  geom_point()
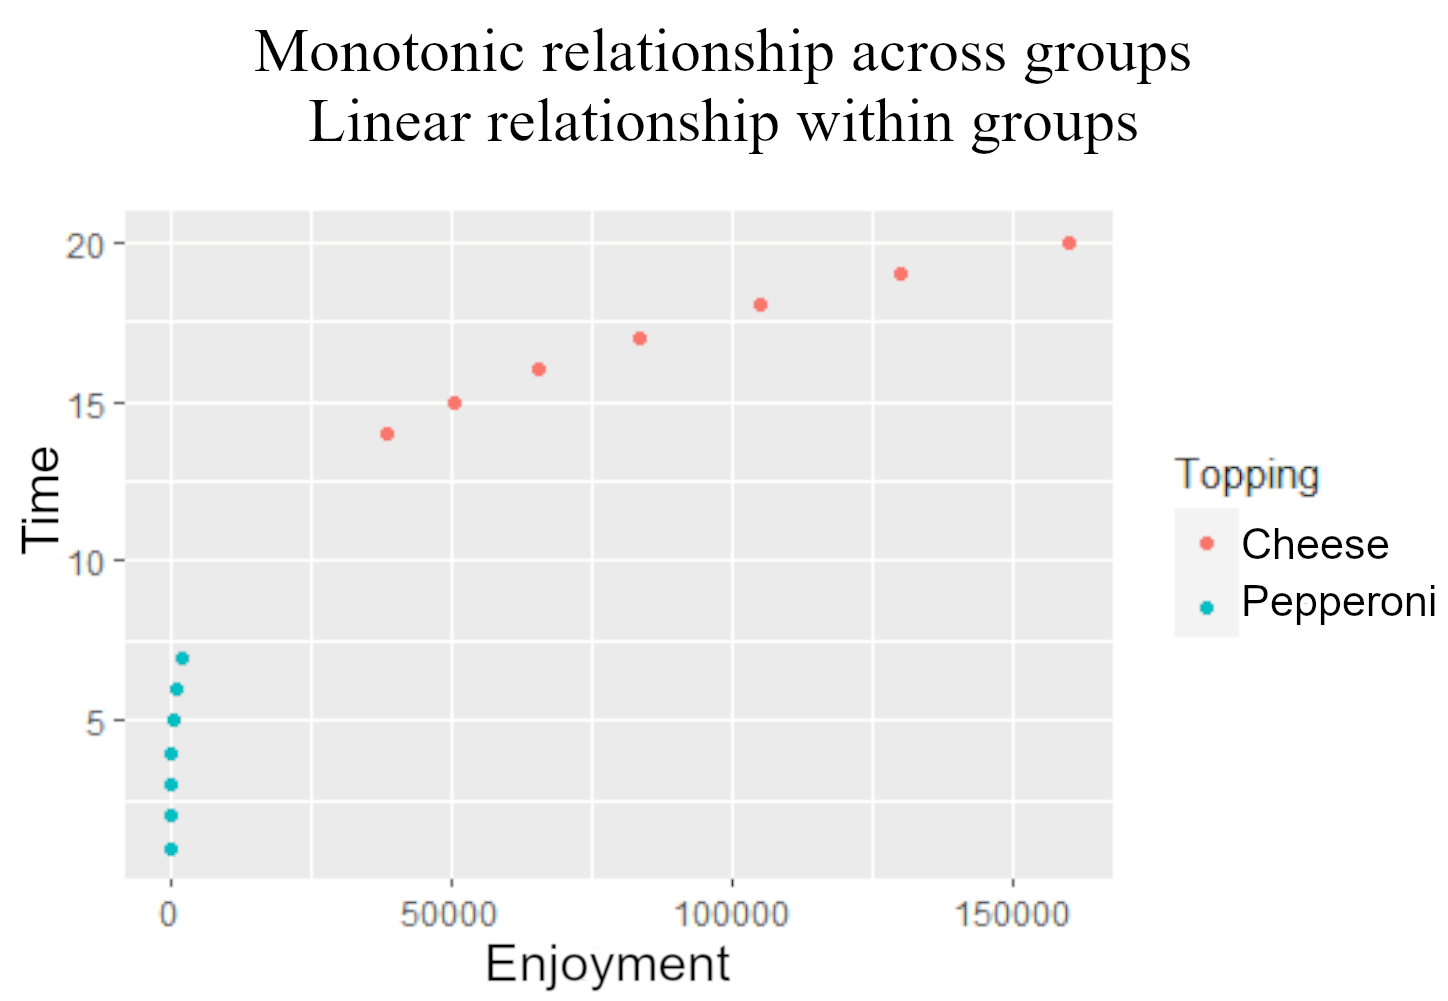
x軸左側に青のチーズデータが急な正の傾き、x軸右側にピンクのペパロニデータが緩やかな正の傾きで示されている。

Rで学ぶA/Bテスト

スピアマンの検出力解析

library(pwr)
pwr.r.test(r = 0.998, n = 90, 
           sig.level = 0.003)
     approximate correlation power 
  calculation (arctangh transformation) 

              n = 90
              r = 0.998
      sig.level = 0.003
          power = 1
    alternative = two.sided
Rで学ぶA/Bテスト

出力の参照

rhotest <- cor.test(~ enjoyment + time, 
         data = pizza, 
         method = "spearman")
samp <- length(pizza$time)
library(pwr)
pwr.r.test(r = rhotest$estimate, 
           sig.level = rhotest$p.value,
           n = samp)
     approximate correlation power 
  calculation (arctangh transformation) 

              n = 90
              r = 0.998
      sig.level = 0.003
          power = 1
    alternative = two.sided
Rで学ぶA/Bテスト

演習に進みましょう!

Rで学ぶA/Bテスト

Preparing Video For Download...