マン=ホイットニーのU検定

Rで学ぶA/Bテスト

Lauryn Burleigh

Data Scientist

マン=ホイットニーU
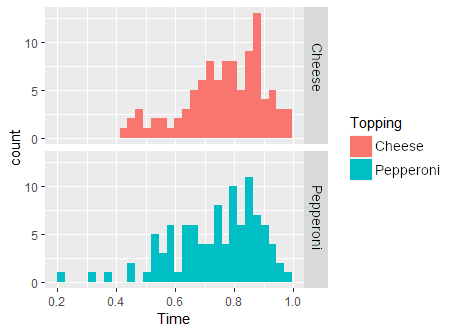
  • チーズ vs ペパロニの食べる時間
  • 非正規分布
  • ノンパラメトリック
    • 分布形を仮定しない
    • マン=ホイットニーのU検定

左に歪んだヒストグラムが2つ。ピンクのペパロニの平均は8、青のチーズの平均は6.2。

Rで学ぶA/Bテスト

仮定

  • 分布形は同じ
  • 中央値の差を評価
  • 正規分布: 平均=中央値
  • 非正規分布: 中央値が適切
  • 追加の仮定でより強力な検定に
  • 帰無仮説: チーズとペパロニの食べる時間の中央値に差はない
library(ggplot2)
ggplot(pizza, aes(x = Time, 
                  fill = Topping)) +
       geom_histogram() + 
       facet_grid(Topping~.)

左に歪んだヒストグラムが2つ。ピンクのペパロニの平均は8、青のチーズの平均は6.2。

Rで学ぶA/Bテスト

サンプルサイズ

library(pwr)
pwr.2p2n.test(h = 0.40, 
              sig.level = 0.05, 
              power = 0.8, n1 = 100)
    difference of proportion power 
 calculation for binomial distribution
              h = 0.4
             n1 = 100
             n2 = 96.29156
      sig.level = 0.05
          power = 0.8
    alternative = two.sided
NOTE: different sample sizes
pwr.2p2n.test(h = 0.40, 
              sig.level = 0.05, 
              power = 0.8, n1 = 110)
    difference of proportion power 
 calculation for binomial distribution
              h = 0.4
             n1 = 110
             n2 = 88.54092
      sig.level = 0.05
          power = 0.8
    alternative = two.sided
NOTE: different sample sizes
  • 予想効果量 h: 順位二系列相関 r
    • グループ内での被験者の順位を見る
Rで学ぶA/Bテスト

検定

wilcox.test(Time ~ Topping, 
            data = Pizza)
  • y ~ x
    • y:データ
    • x:グループ
    Wilcoxon rank sum test with 
    continuity correction
data:  Enjoyment by Topping
W = 6051, p-value = 0.01026
alternative hypothesis: true location 
shift is not equal to 0
Rで学ぶA/Bテスト

効果量と検出力

効果量

library(effectsize)
rank_biserial(Time ~ Topping, 
              data = pizza)
r (rank biserial) |         95% CI
<----------------------------------
0.21              | [0.05, 0.36]
  • 小: 0.1
  • 中: 0.3
  • 大: 0.5

1 - 0.14 = 0.86 第II種過誤の確率

検出力分析

library(pwr)
pwr.2p2n.test(h = 0.21, sig.level = 0.01, 
              n1 = 100, n2 = 100)
     difference of proportion power calculation for binomial distribution 

              h = 0.21
             n1 = 100
             n2 = 100
      sig.level = 0.01
          power = 0.1376818
    alternative = two.sided

NOTE: different sample sizes
Rで学ぶA/Bテスト

練習してみましょう!

Rで学ぶA/Bテスト

Preparing Video For Download...