SAS ユーザーのための R
Melinda Higgins, PhD
Research Professor/Senior Biostatistician Emory University

ggplot2 は R 向けの強力なグラフィックスパッケージですggplot の「GG」は「グラフィックスの文法」を意味しますggplot2 はレイヤーを重ねてグラフィックスを構築します# Create plot for x=sex and y=diameter
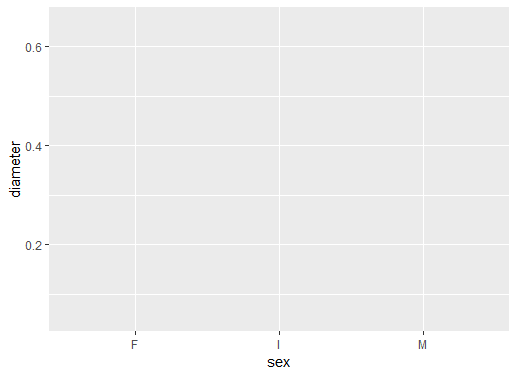
ggplot(data = abalone, aes(sex, diameter))
ggplot() でベースレイヤーを定義しますdata = abalone を設定しますaes に sex と diameter を設定します
プロットにはまだ描画オブジェクトがありません
sex の準備ができていますdiameter の準備ができています
# Add boxplot geometric object or geom
ggplot(data = abalone,
aes(sex, diameter)) +
geom_boxplot()
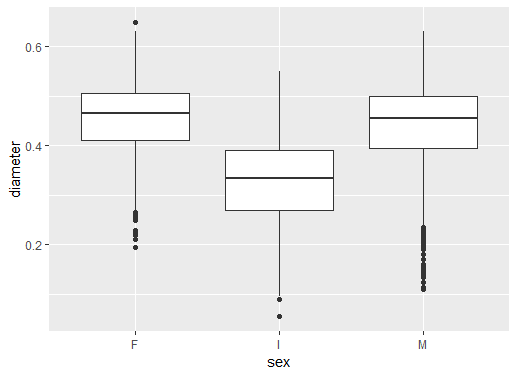
+ でレイヤーを追加しますボックスプロット geom_boxplot() を追加しました
結果は複数のボックスプロットになります
F はメス、I は幼体、M はオスを表します
# Add black white theme
ggplot(data = abalone,
aes(sex, diameter)) +
geom_boxplot() +
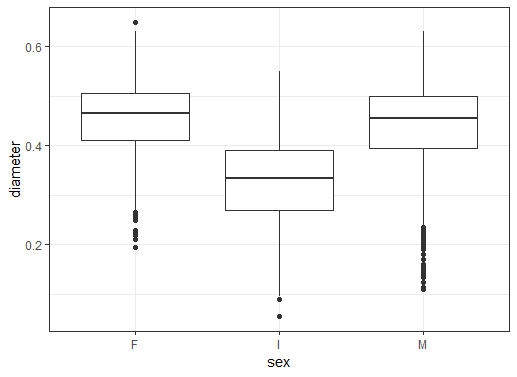
theme_bw()
theme_bw() を使って「テーマ」レイヤーを追加します
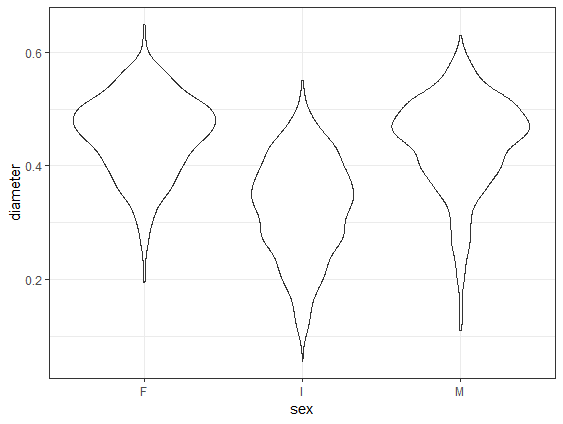
# Change to geom_violin()
ggplot(data = abalone,
aes(sex, diameter)) +
geom_violin() +
theme_bw()
geom_violin が geom_boxplot を置き換えます
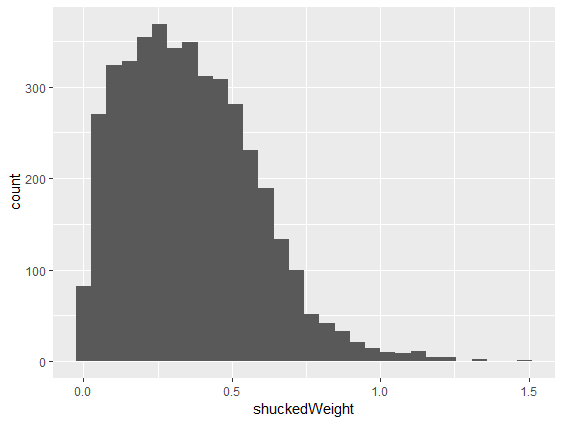
# Make histogram of shuckedWeight
ggplot(abalone, aes(shuckedWeight)) +
geom_histogram()
geom_histogram() を追加しますaes() に shuckedWeight を設定します
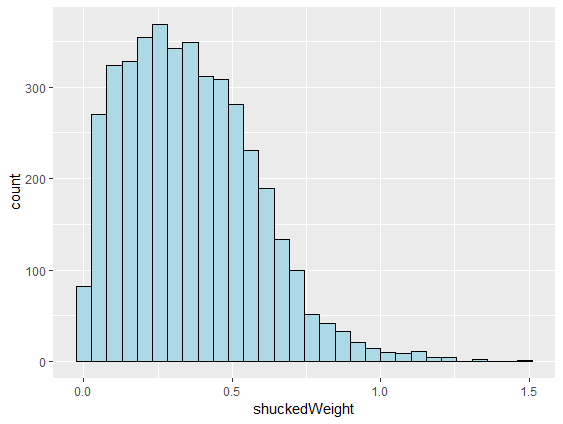
# Make lines black and fill light blue
ggplot(abalone, aes(shuckedWeight)) +
geom_histogram(color = "black",
fill = "lightblue")
color を設定しますfill カラーを設定します() の中に設定します
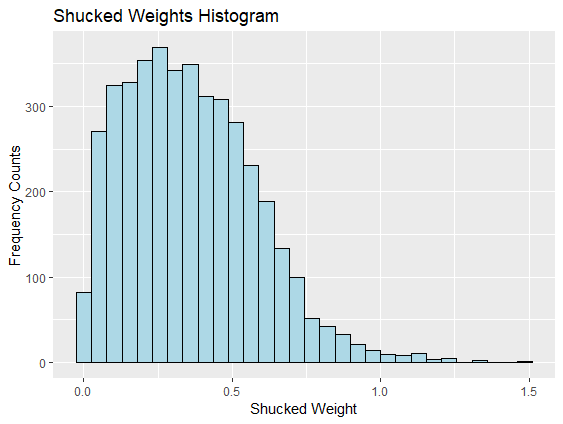
# Add x, y axis labels and title
ggplot(abalone, aes(shuckedWeight)) +
geom_histogram(color = "black",
fill = "lightblue") +
xlab("Shucked Weight") +
ylab("Frequency Counts") +
ggtitle("Shucked Weights Histogram")
xlab() と ylab() を使いますggtitle() を使います
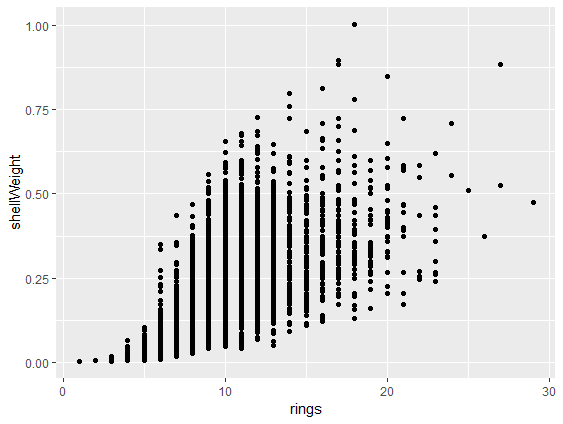
# Make scatterplot with geom_point()
ggplot(abalone,
aes(rings, shellWeight)) +
geom_point()
aes には2つの変数が必要ですgeom_point() で点を追加します
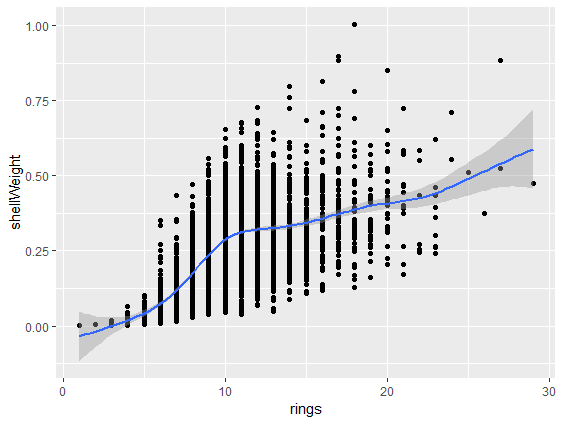
# Add smoothed fit line
ggplot(abalone,
aes(rings, shellWeight)) +
geom_point() +
geom_smooth()
geom_smooth() の線を追加します
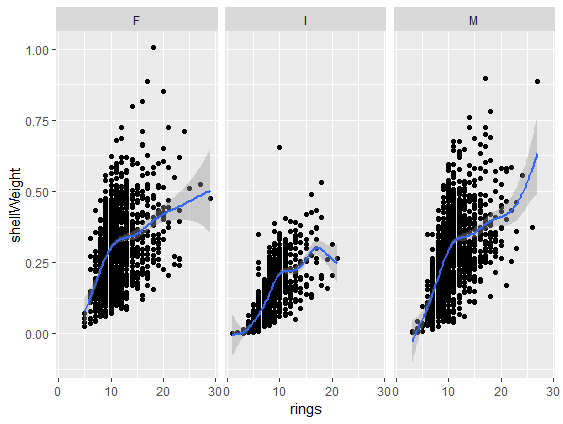
# Add panels using facet_wrap()
ggplot(abalone,
aes(rings, shellWeight)) +
geom_point() +
geom_smooth() +
facet_wrap(vars(sex))
facet_wrap() レイヤーを追加しますvars(sex) でパネルの変数を定義します
ggplot2 によるグラフ作成スキルの基礎SAS ユーザーのための R