Rで学ぶSupport Vector Machines
Kailash Awati
Instructor
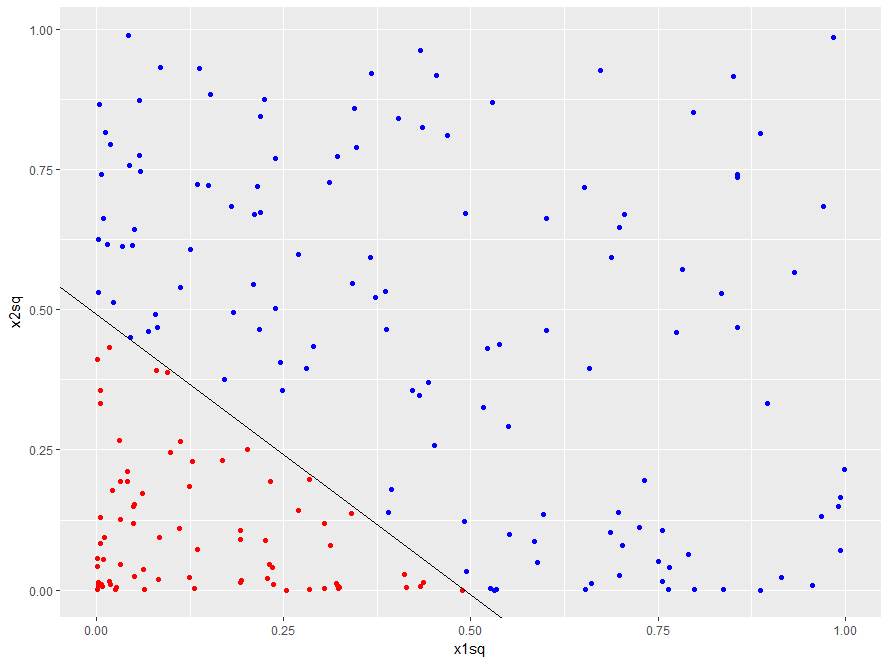
ggplot()
p <- ggplot(data = df4, aes(x = x1sq, y = x2sq, color = y)) +
  geom_point() +
  scale_color_manual(values = c("red", "blue")) +
  geom_abline(slope = -1, intercept = 0.49)

p
(gamma * (u.v) + coef0) ^ degree
degree
gamma
coef0
u
v
degree = 2
cost
svm_model <- svm(y ~ ., data = trainset, type = "C-classification", kernel = "polynomial", degree = 2)
# Predictions
pred_test <- predict(svm_model, testset)
mean(pred_test == testset$y)
0.9354839
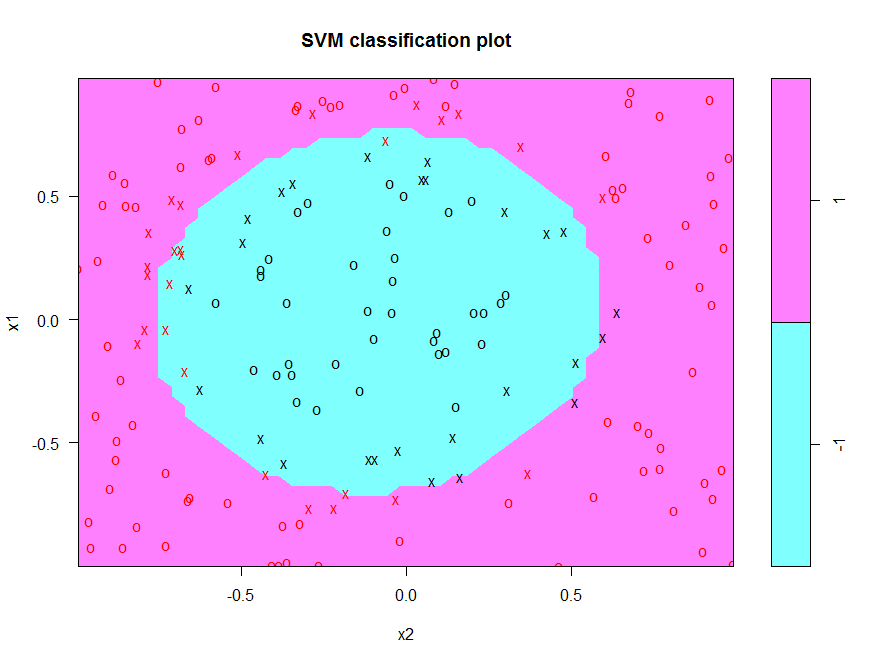
# Visualize model
plot(svm_model, trainset)