# Preliminaries...
# Set required number of data points
n <- 200
# Set seed to ensure reproducibility
set.seed(42)

# Generate dataframe with two predictors x1 and x2 in (0,1)
df <- data.frame(x1 = runif(n),
                 x2 = runif(n))
2クラスの作成
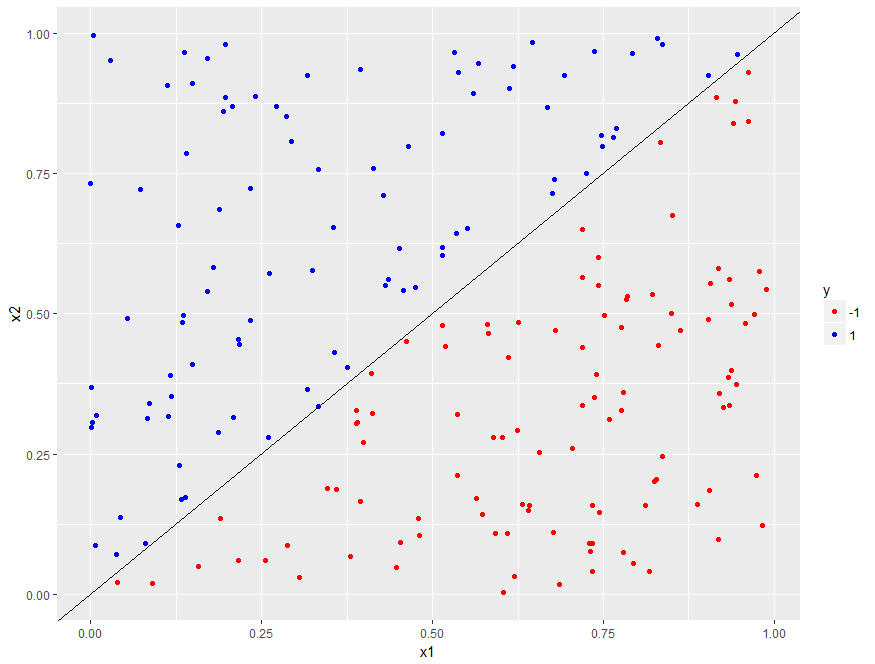
直線の決定境界 x1 = x2 で分割された2クラスを作成します
直線は(0, 0)を通り、水平方向と45度をなします
直線より下の点は y = -1、上の点は y = 1
# Classify points as -1 or +1
df$y <- factor(ifelse(df$x1 - df$x2 > 0, -1, 1),
               levels = c(-1, 1))
ggplotによるデータセットの可視化
x軸にx1、y軸にx2をとった2次元散布図を作成します
クラスを色で区別(直線より下=赤、上=青)
決定境界は x1 = x2:(0, 0)を通り傾き = 1
library(ggplot2)

# Build plot
p <- ggplot(data = df, aes(x = x1, y = x2, color = y)) +
     geom_point() +
     scale_color_manual(values = c("-1" = "red", "1" = "blue")) +
     geom_abline(slope = 1, intercept = 0)

# Display it
p
マージンの導入
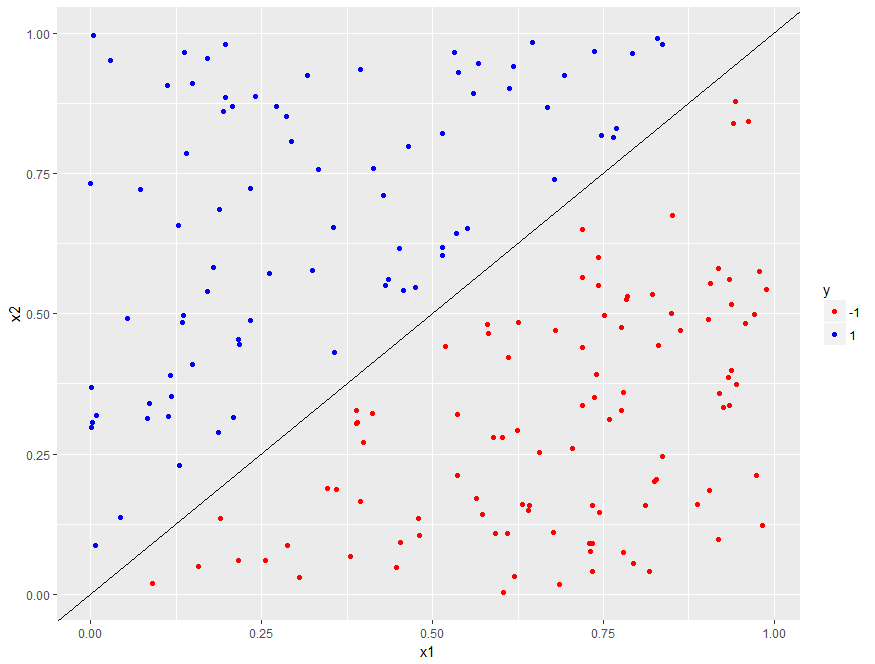
マージンを作成するには、境界に近い点を除外する必要があります
x1とx2の差が指定値未満の点を除外します
# Create a margin of 0.05 in dataset
delta <- 0.05
# Retain only those points that lie outside the margin
df1 <- df[abs(df$x1 - df$x2) > delta, ]
# Check number of data points remaining
nrow(df1)

# Replot dataset with margin (code is exactly same as before)
p <- ggplot(data = df1, aes(x = x1, y = x2, color = y)) +
     geom_point() +
     scale_color_manual(values = c("red", "blue")) +
     geom_abline(slope = 1, intercept = 0)
# Display plot
p
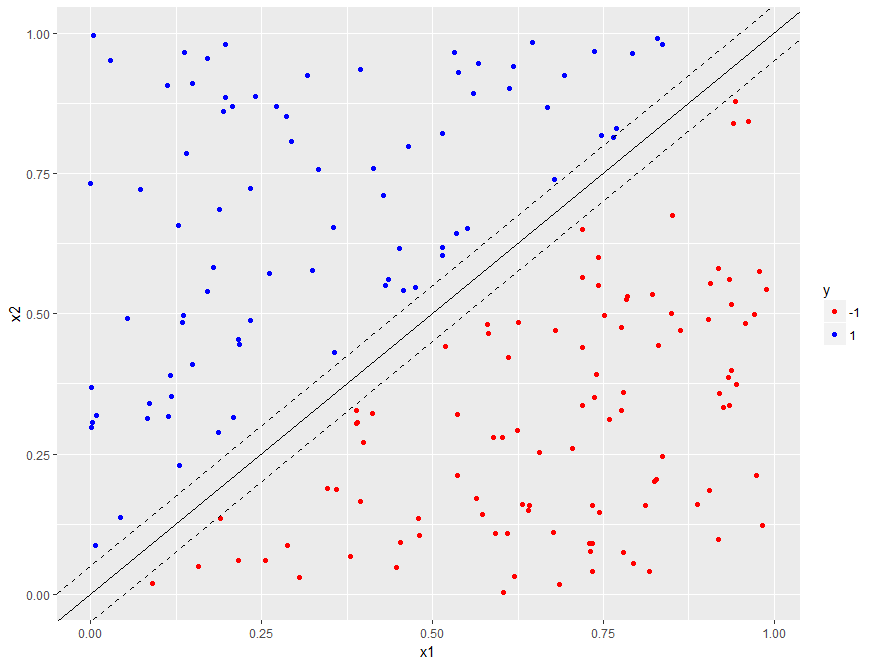
マージン境界のプロット
マージン境界の特徴:
決定境界と平行(傾き = 1)。
決定境界からdeltaの距離に位置(delta = 0.05)。
p <- p +
     geom_abline(slope = 1, intercept = delta, linetype = "dashed") +
     geom_abline(slope = 1, intercept = -delta, linetype = "dashed")

p