放射状に分離可能なデータセットの生成

Rで学ぶSupport Vector Machines

Kailash Awati

Instructor

2次元一様分布点群の生成

  • 200点のデータセットを生成する
    • 2つの予測変数 x1x2、-1から1の一様分布。
# Set required number of datapoints
n <- 200
# Set seed to ensure reproducibility
set.seed(42)

# Generate dataframe with 2 predictors x1 and x2 in (-1, 1)
df <- data.frame(x1 = runif(n, min = -1, max = 1),
                 x2 = runif(n, min = -1, max = 1))
Rで学ぶSupport Vector Machines

円形境界の作成

  • 半径0.7の円形決定境界を作成する。
  • カテゴリ変数yは、境界の外側なら+1、内側なら-1。
radius <- 0.7
radius_squared <- radius ^ 2

#categorize data points depending on location wrt boundary
df$y <- factor(ifelse(df$x1 ^ 2 + df$x2 ^ 2 < radius_squared, -1, 1),
               levels = c(-1, 1))
Rで学ぶSupport Vector Machines

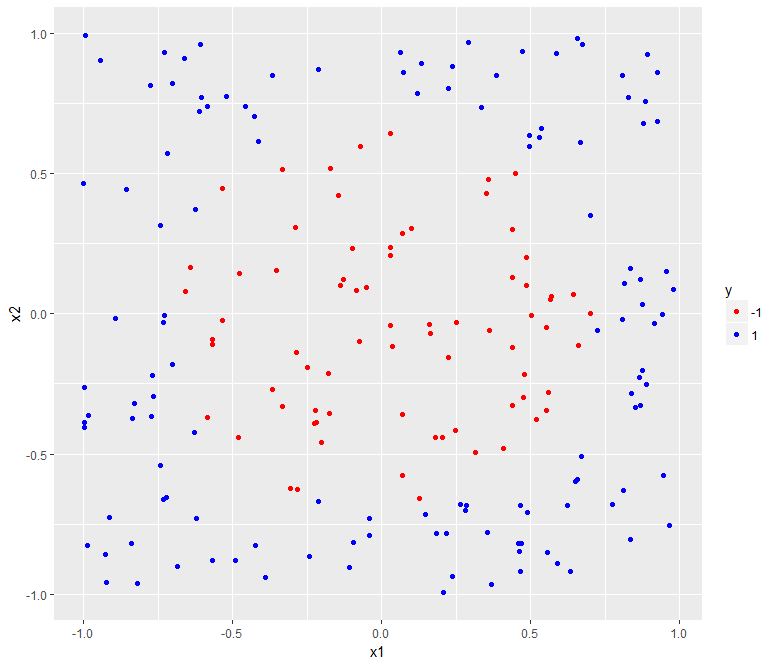
データセットのプロット

  • ggplotで可視化する。
library(ggplot2)
  • 予測変数を2軸にプロット;クラスを色で区別する。
# Build plot
p <- ggplot(data = df, aes(x = x1, y = x2, color = y)) + 
     geom_point() + 
     scale_color_manual(values = c("-1" = "red", "1" = "blue")) 
# Display plot 
p
Rで学ぶSupport Vector Machines

第3章1節 - 放射状分離可能データセット

Rで学ぶSupport Vector Machines

円形境界の追加 - パート1

  • 円を生成する関数を作成する
# Function generates dataframe with points
# lying on a circle of radius r
circle <- 
  function(x1_center, x2_center, r, npoint = 100) {

  # Angular spacing of 2*pi/npoint between points
  theta <- seq(0, 2 * pi, length.out = npoint)
  x1_circ <- x1_center + r * cos(theta)
  x2_circ <- x2_center + r * sin(theta)

  data.frame(x1c = x1_circ, x2c = x2_circ)
}
Rで学ぶSupport Vector Machines

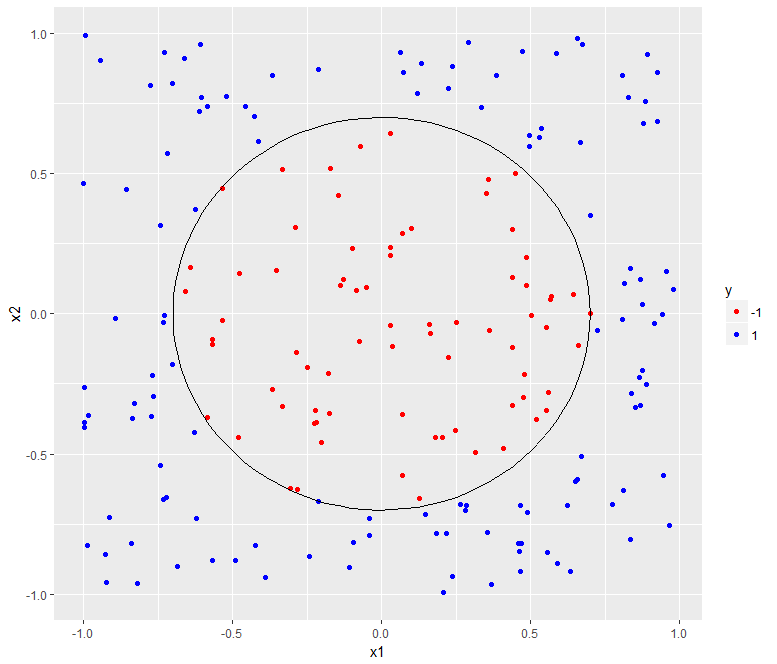
円形境界の追加 - パート2

  • プロットに境界を追加するには:
    • circle() 関数で境界を生成する。
    • geom_path() で境界をプロットに追加する。
# Generate boundary
boundary <- circle(x1_center = 0,
                   x2_center = 0,
                   r = radius)
# Add boundary to previous plot
p <- p + 
     geom_path(data = boundary,
               aes(x = x1c, y = x2c),
               inherit.aes = FALSE)
# Display plot
p
Rで学ぶSupport Vector Machines

第3章1節 - 決定境界付き放射状分離可能データセット

Rで学ぶSupport Vector Machines

練習しましょう!

Rで学ぶSupport Vector Machines

Preparing Video For Download...