Rで学ぶソーシャルメディアデータ分析
Sowmya Vivek
Data Science Coach

library(rtweet)
# 「#politics」のツイートを18000件取得
pol <- search_tweets("#politics", n = 18000)
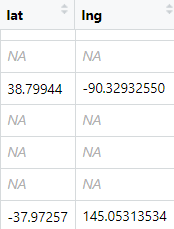
# 位置情報を抽出し新しい列を追加
pol_coord <- lat_lng(pol)
coords_coordsまたはbbox_coords列から抽出されますView(pol_coord)

# latとlngが欠損の行を除去
pol_geo <- na.omit(pol_coord[, c("lat", "lng")])
head(pol_geo)
lat lng
<dbl> <dbl>
19.17414 72.874244
53.35490 -6.247621
53.27350 -6.399521
53.67989 9.372680
12.92311 77.558448
54.59940 -5.836670
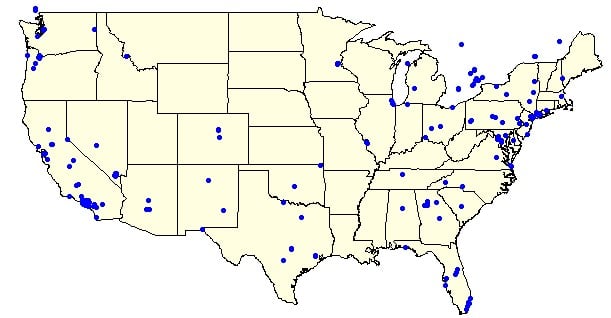
# ツイートの経度・緯度を米国州地図にプロット
map(database = "state", fill = TRUE, col = "light yellow")
with(pol_geo, points(lng, lat, pch = 20, cex = 1, col = 'blue'))

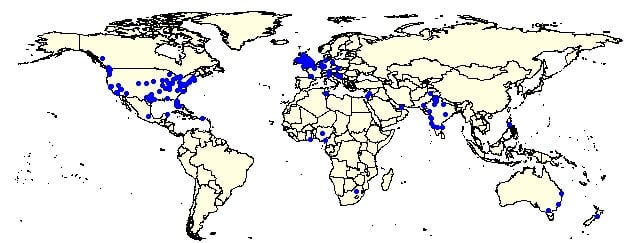
# ツイートの経度・緯度を世界地図にプロット
map(database = "world", fill = TRUE, col = "light yellow")
with(pol_geo, points(lng, lat, pch = 20, cex = 1, col = 'blue'))

Rで学ぶソーシャルメディアデータ分析