クラスターサンプリング

Pythonで学ぶアンケートデータ分析

EbunOluwa Andrew

Data Scientist

クラスターサンプリングとは

  • 全母集団を複数の下位集団に分割

    • 下位集団は母集団と似た特徴を持つ
  • 母集団 -> クラスター

  • 個人ではなく、下位集団全体を無作為に抽出

人々で構成された円グラフ

Pythonで学ぶアンケートデータ分析

クラスターサンプリングが重要な理由

  • 母集団全体から常に収集できるとは限らない
  • 母集団が大きいことによる誤差を最小化

人口過密

Pythonで学ぶアンケートデータ分析

クラスターサンプリングの手順

  • まず、母集団をクラスターに分割
  • 次に、これらのクラスターを無作為に抽出

人々のクラスター

Pythonで学ぶアンケートデータ分析

サンプルデータ

print(mh_survey)
| gender | sought_treatment | country_work             |
|--------|------------------|--------------------------|
| Male   |                0 | United Kingdom           |
| Male   |                1 | United States of America |
| Male   |                1 | United Kingdom           |
| Male   |                1 | United Kingdom           |
| Female |                1 | United States of America |
| Male   |                1 | United Kingdom           |
| Male   |                0 | United States of America |
...
Pythonで学ぶアンケートデータ分析

サンプルデータとプロット

mh_survey.groupby('country_work')[
  'gender'].count()
groups = mh_survey.groupby(
  'country_work')['gender'].count(
).reset_index()
groups.columns=['country_work','count']

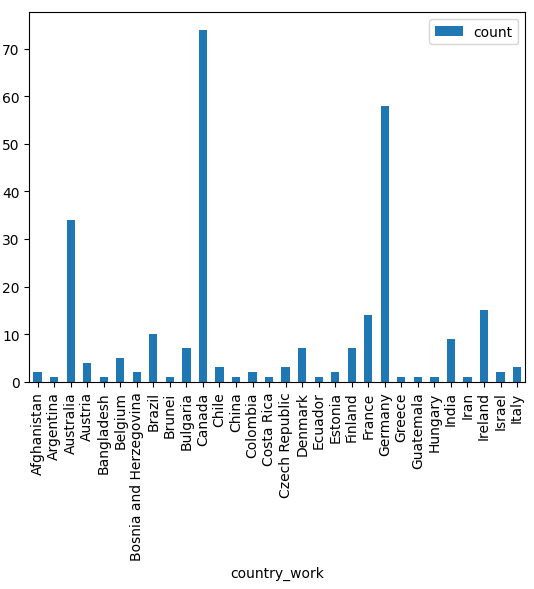
groups.plot.bar(x='country_work',
                y='count')

テックワーカーの居住国の棒グラフ

1 _スペースの都合で一部のみ表示_
Pythonで学ぶアンケートデータ分析

クラスターを選ぶ

unique_countries = list(set(mh_survey.country_work))

random_clusters = np.random.choice(unique_countries, size = 10, replace = False)

print(random_clusters)
array(['Finland', 'Australia', 'Sweden', 'South Africa', 'Pakistan',
       'France', 'Ecuador', 'United Arab Emirates', 'United Kingdom',
       'Bangladesh'], dtype='<U24')
Pythonで学ぶアンケートデータ分析

クラスターサンプルを作成

cluster_sample = mh_survey[mh_survey.country_work.isin(random_clusters)]
print(cluster_sample.head())
| gender | sought_treatment | US_state_live        |
|--------|------------------|----------------------|
| Male   |                1 |             Pakistan |
| Male   |                1 |             Pakistan |
| Male   |                1 | United Arab Emirates |
| Male   |                1 |             Pakistan |
| Female |                0 |           Bangladesh |
Pythonで学ぶアンケートデータ分析

クラスターサンプルを可視化

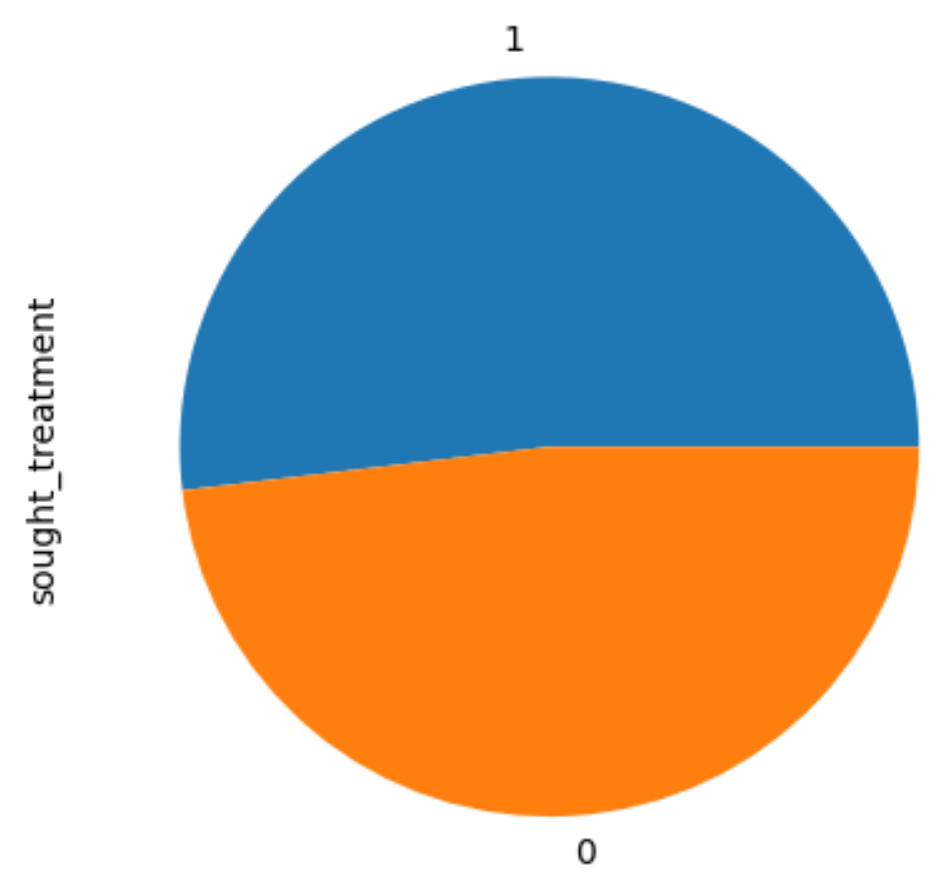
treatment_pie = cluster_sample.sought_treatment.value_counts(normalize = True)
treatment_pie.plot.pie()

sought_treatment の円グラフ

Pythonで学ぶアンケートデータ分析

クラスターサンプルを可視化

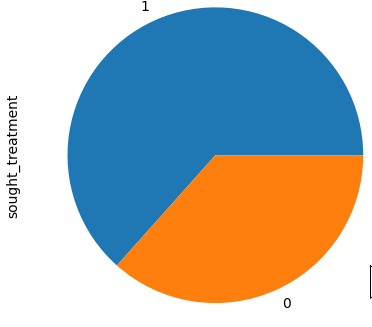
array(['Bangladesh', 'South Africa', 'Other', 'Norway', 'Poland',
       'Romania', 'New Zealand', 'France', 'United States of America',
       'Bulgaria'], dtype='<U24')

sought_treatment の円グラフ

Pythonで学ぶアンケートデータ分析

Passons à la pratique !

Pythonで学ぶアンケートデータ分析

Preparing Video For Download...