重み付きサンプリング

Pythonで学ぶアンケートデータ分析

EbunOluwa Andrew

Data Scientist

重み付きサンプリングとは

  • 不均等な確率
  • 収集時の偏りを補正可能

テーブル上の天秤、はかり、バランス

Pythonで学ぶアンケートデータ分析

重み付けで使う主な変数

  • 性別・年齢・地域・学歴などの属性
  • 研究参加者/非参加者の差を考慮

家族、異なる年齢の人々のアウトライン

Pythonで学ぶアンケートデータ分析

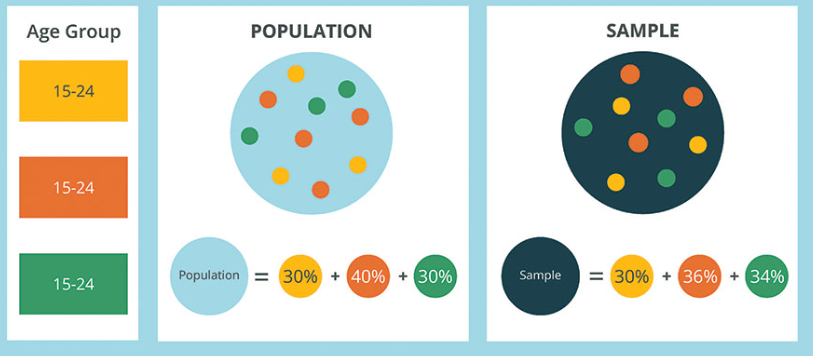
セルベース重み付け

1 https://www.geopoll.com/blog/weighting-survey-data-raking-cell-weighting/
Pythonで学ぶアンケートデータ分析

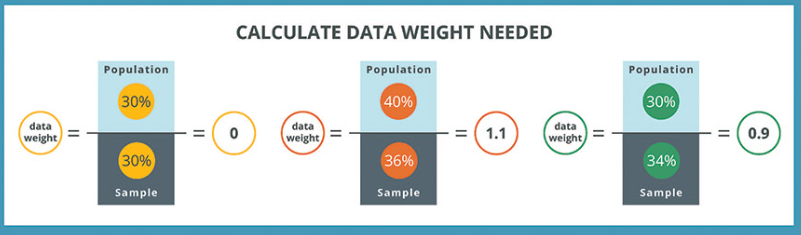
セルベース重み付け

1 https://www.geopoll.com/blog/weighting-survey-data-raking-cell-weighting/
Pythonで学ぶアンケートデータ分析

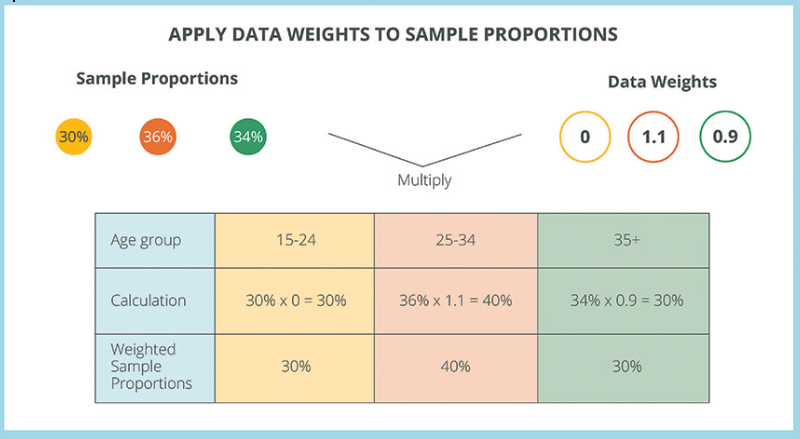
セルベース重み付け

1 https://www.geopoll.com/blog/weighting-survey-data-raking-cell-weighting/
Pythonで学ぶアンケートデータ分析

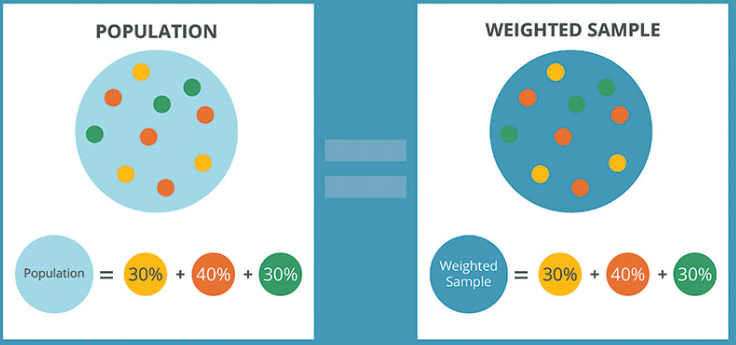
セルベース重み付け

1 https://www.geopoll.com/blog/weighting-survey-data-raking-cell-weighting/
Pythonで学ぶアンケートデータ分析

Pythonで若年層の支出傾向を分析

yp_survey
| Gender | Age | Entertainment |
|--------|-----|---------------|
| female |  19 | Agree         |
| female |  20 | Agree         |
| male   |  19 | Agree         |
| female |  19 | Disagree      |
| female |  24 | Disagree      |
| male   |  18 | Agree         |
| male   |  18 | Agree         |
| male   |  20 | Disagree      |
Pythonで学ぶアンケートデータ分析

Pythonで若年層の支出傾向を分析

import pandas as pd
yp_crosstab = pd.crosstab(
  yp_survey['Gender'],
  yp_survey['Entertainment'])
yp_crosstab
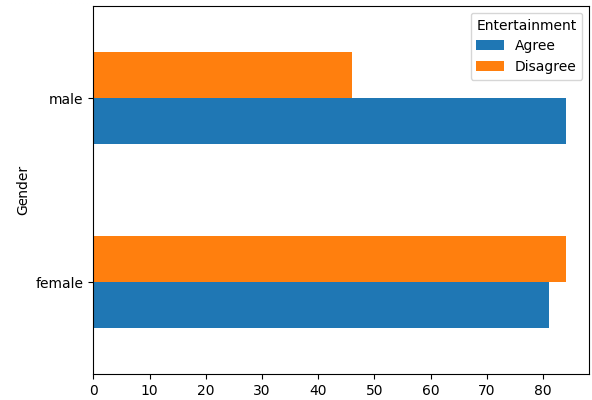
yp_crosstab.plot.barh()
|        | Agree | Disagree |
|--------|-------|----------|
| female |    81 |       84 |
| male   |    84 |       46 |

Pythonで学ぶアンケートデータ分析

Pythonで若年層の支出傾向を分析

survey = yp_survey.groupby(['Gender', 'Entertainment'])['Age'].count().reset_index()

survey.columns = ['Gender', 'Entertainment', 'Respondents'] survey
| Gender | Entertainment | Respondents |
|--------|---------------|-------------|
| female | Agree         |          81 |
| female | Disagree      |          84 |
| male   | Agree         |          84 |
| male   | Disagree      |          46 |
Pythonで学ぶアンケートデータ分析

Pythonで若年層の支出傾向を分析

survey['% total respondents'] = survey.Respondents * 100./survey.Respondents.sum()
survey['% of population'] = [35, 25, 20, 20]
survey['Weight'] = survey['% of population']/survey['% total respondents']
survey['Weighted Respondents'] = survey.Weight * survey.Respondents
Pythonで学ぶアンケートデータ分析

Pythonで若年層の支出傾向を分析

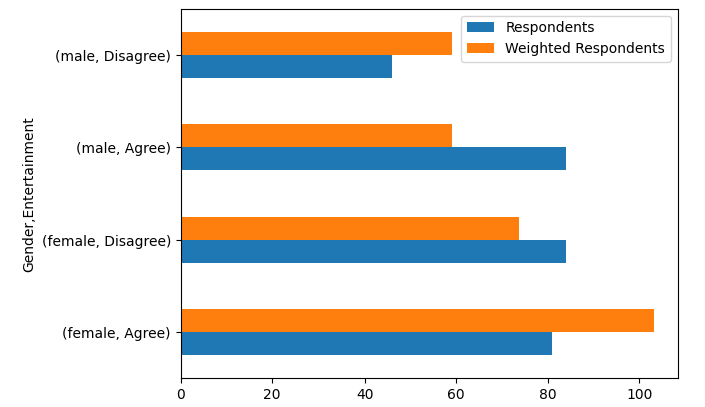
survey[['Gender','Entertainment',
        'Respondents','Weighted Respondents']].set_index(
  ['Gender','Entertainment']).plot.barh()

Pythonで学ぶアンケートデータ分析

Passons à la pratique !

Pythonで学ぶアンケートデータ分析

Preparing Video For Download...