MATLABユーザーのためのPython
Justin Kiggins
Product Manager
print(arr)
[[2, 4, 8, 16, 32]]
print(arr[2])
8
print(arr[0])
2
print(arr[-1])
32
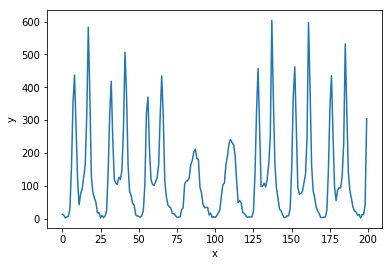
import matplotlib.pyplot as plt
# 新しい図を作成
plt.figure()

# xに対するyをプロット
plt.plot(x, y)

# x軸・y軸ラベルを設定
plt.xlabel('x')
plt.ylabel('y')

# プロットを表示
plt.show()
# 新しい図を作成 plt.figure()
# xに対するyをプロット plt.plot(x, y)
# x軸・y軸ラベルを設定 plt.xlabel('x') plt.ylabel('y')
# プロットを表示 plt.show()