平均ベクトルと分散共分散行列

Rによる多変量確率分布

Surajit Ray

Professor, University of Glasgow

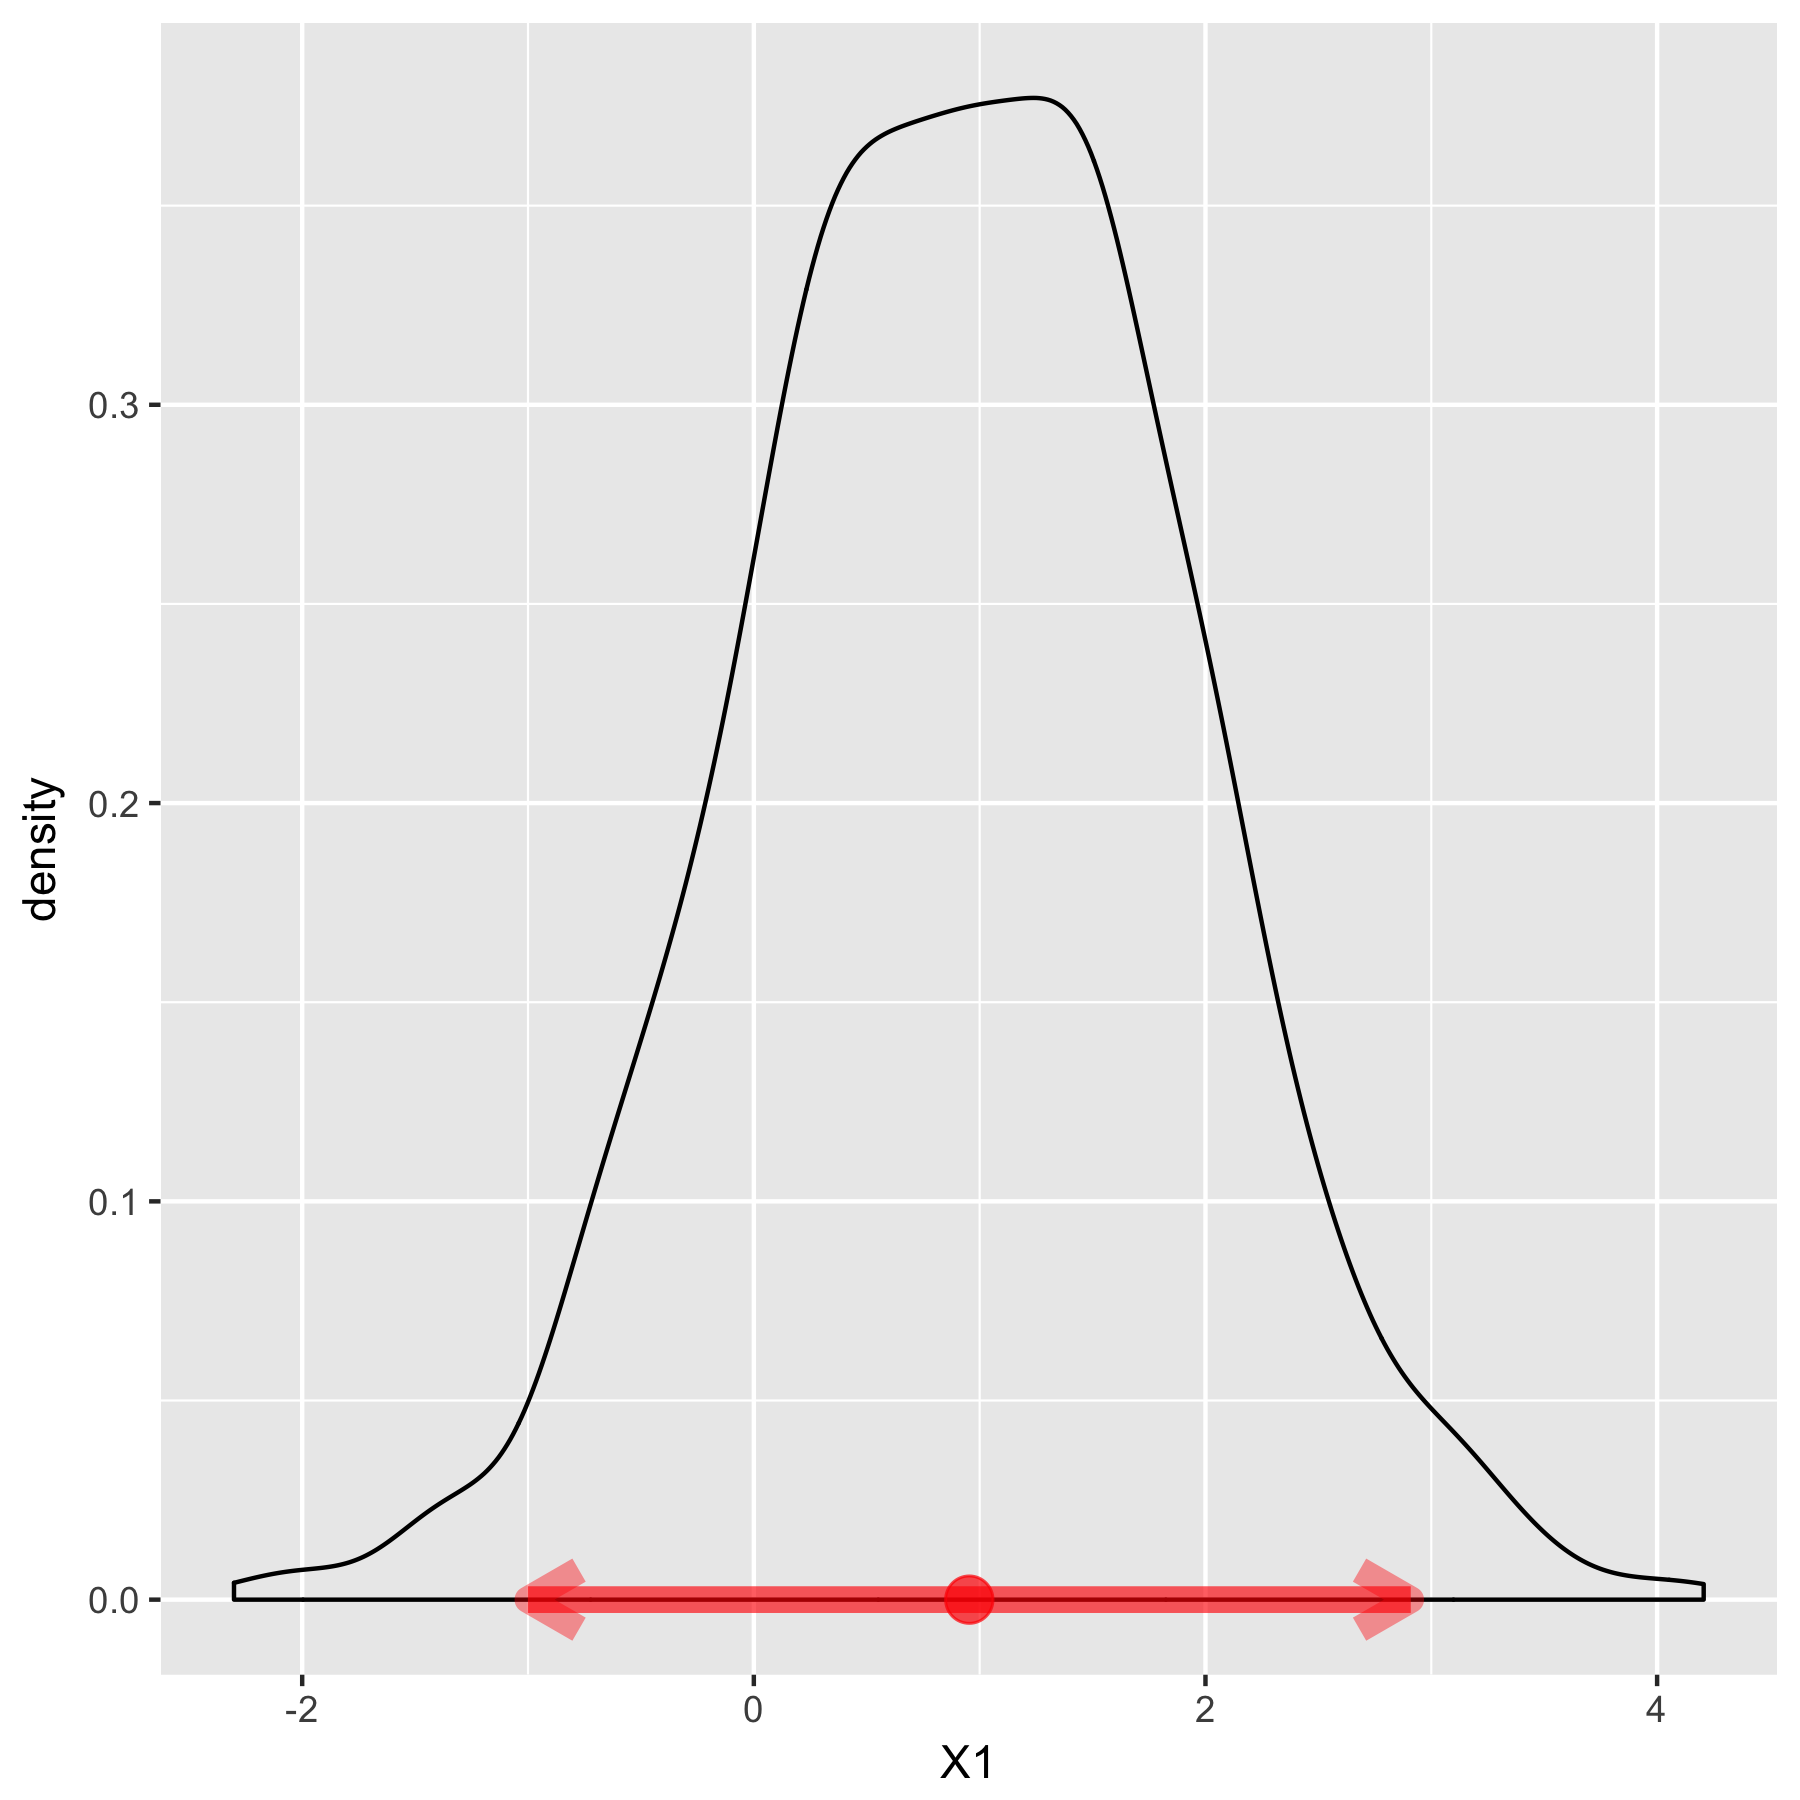
平均は分布の位置を表す
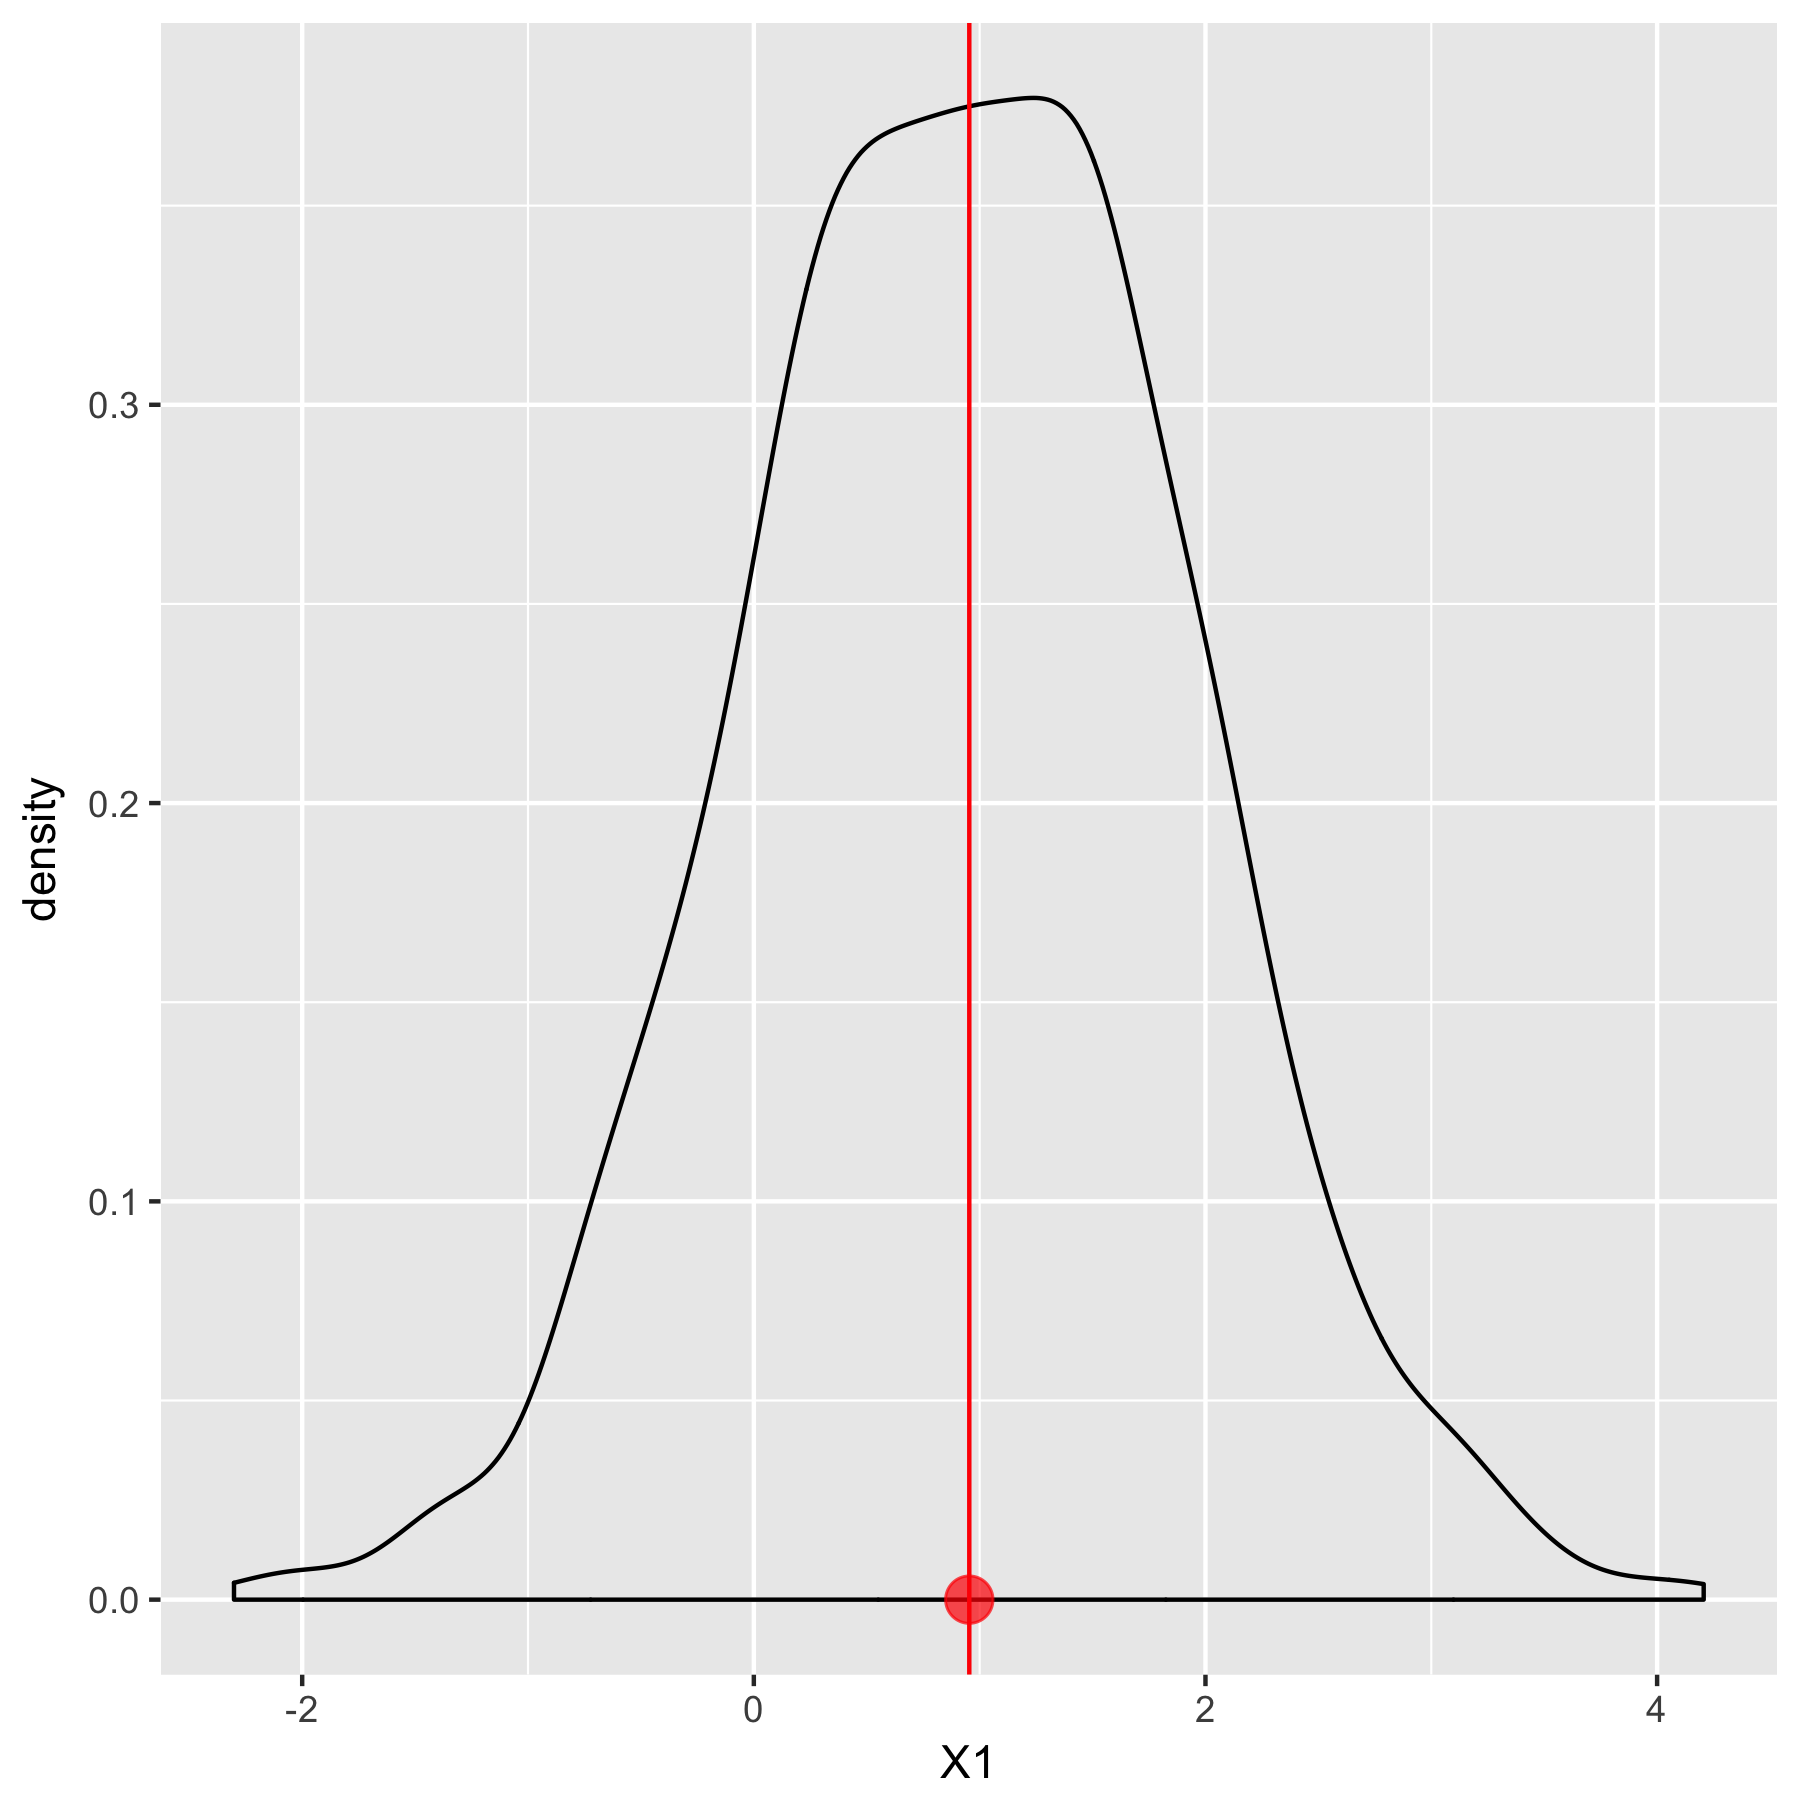
                                               平均 $0.95$
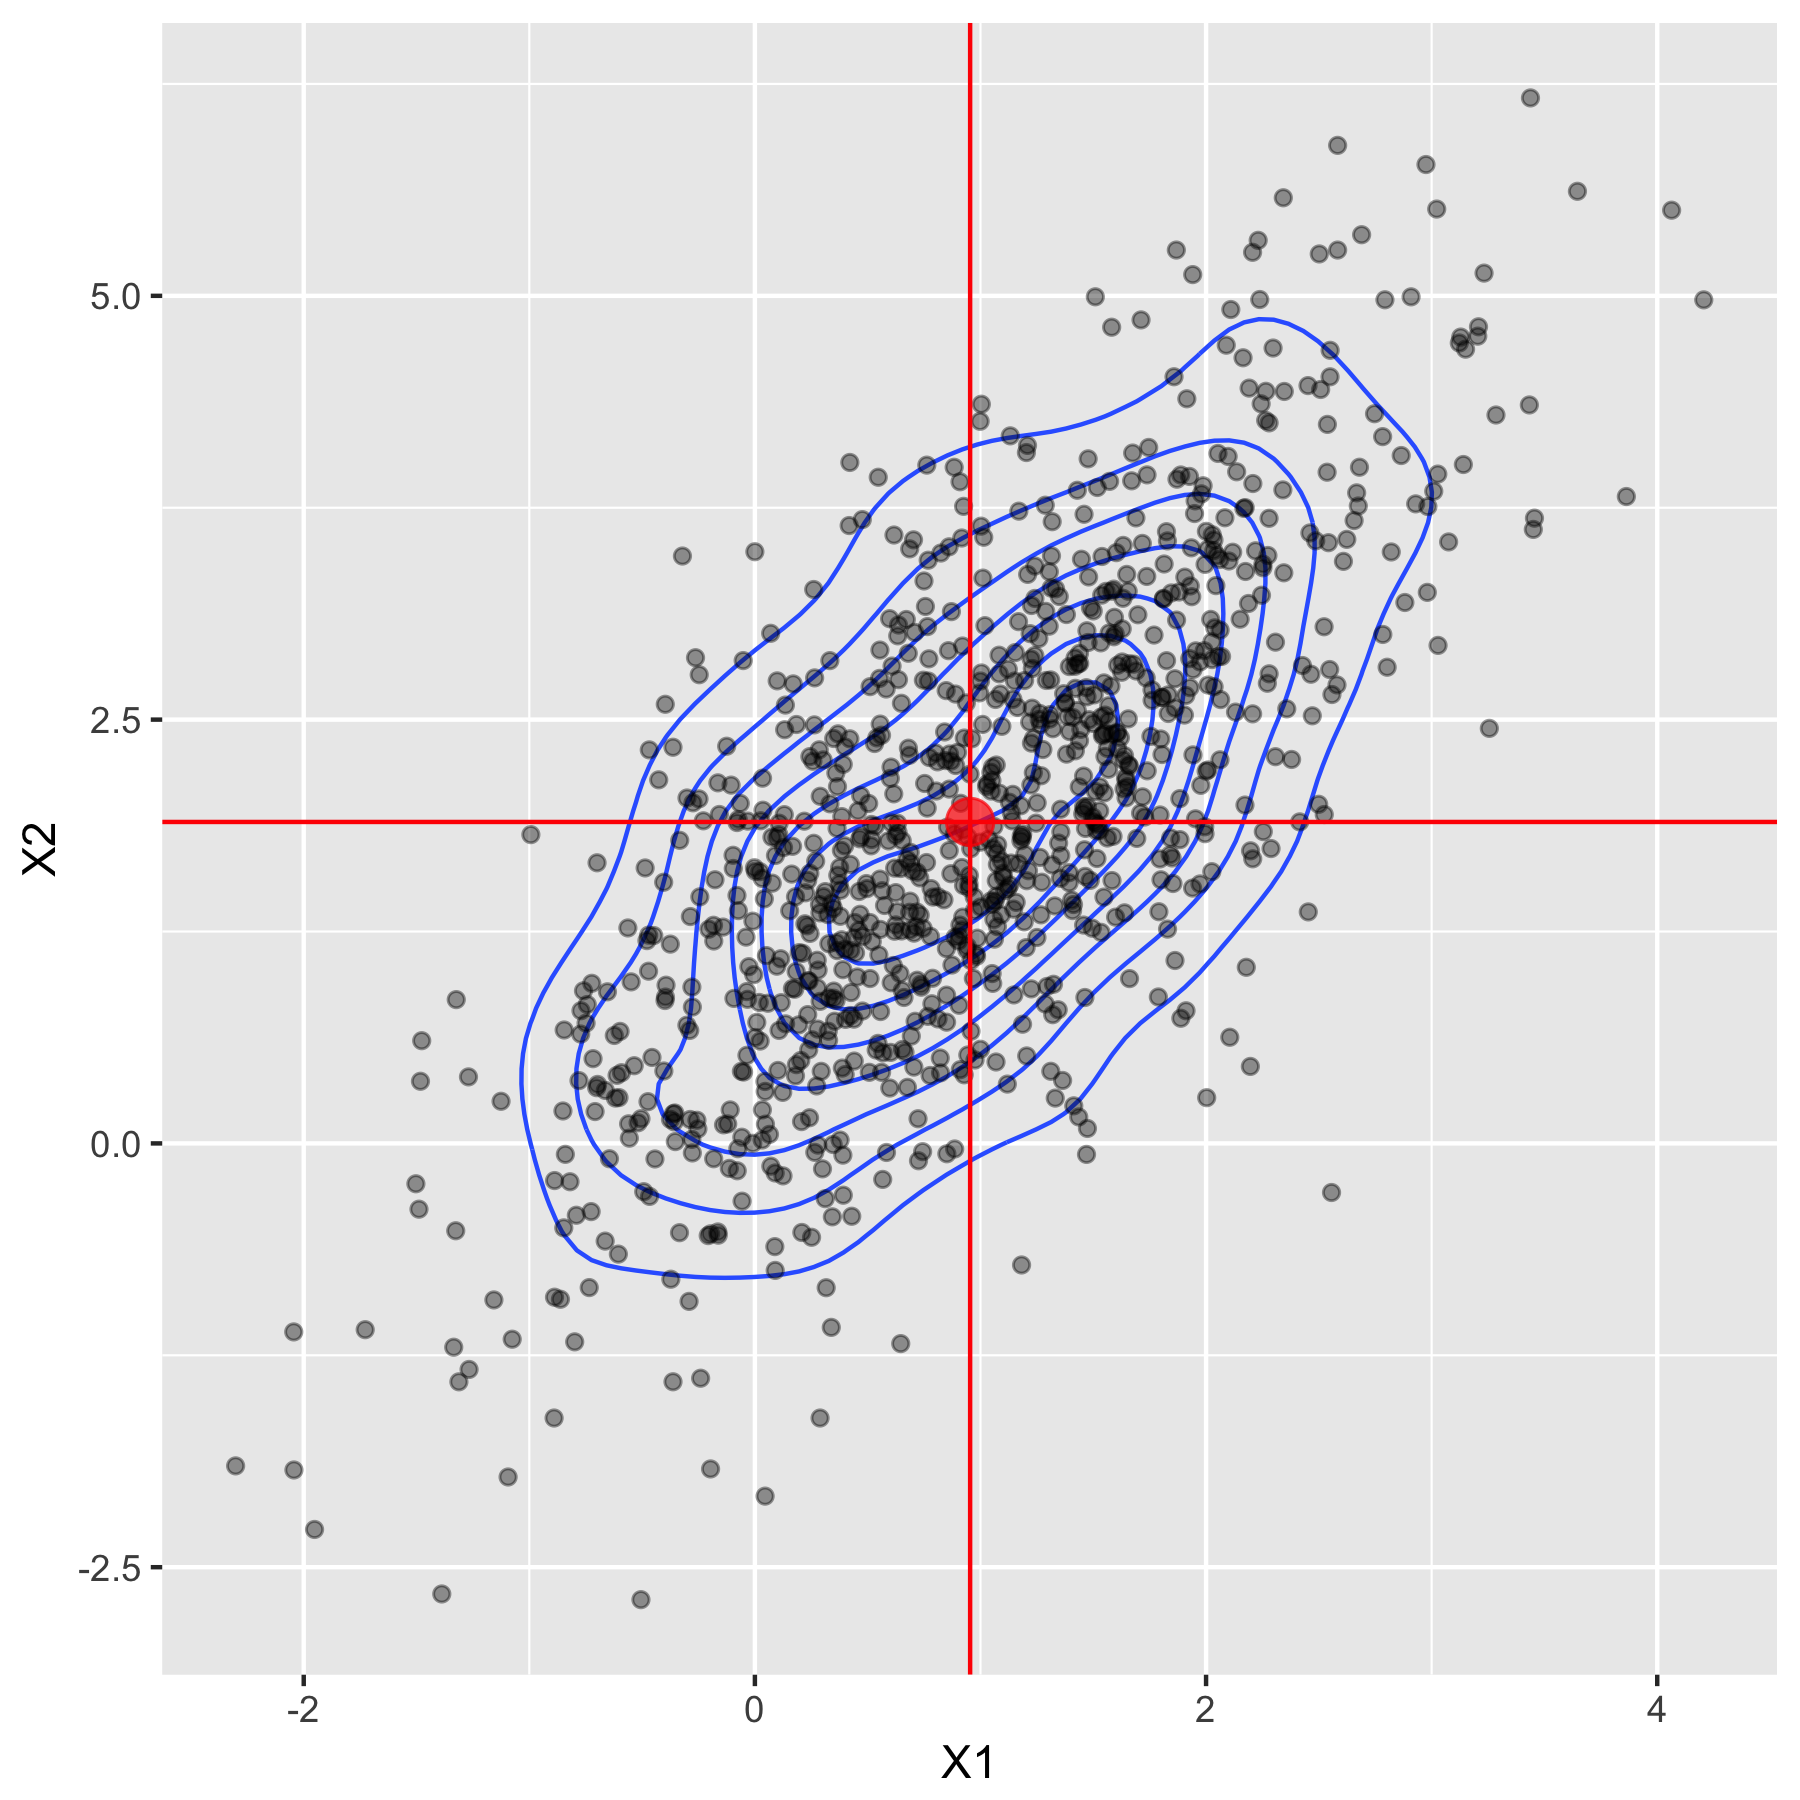
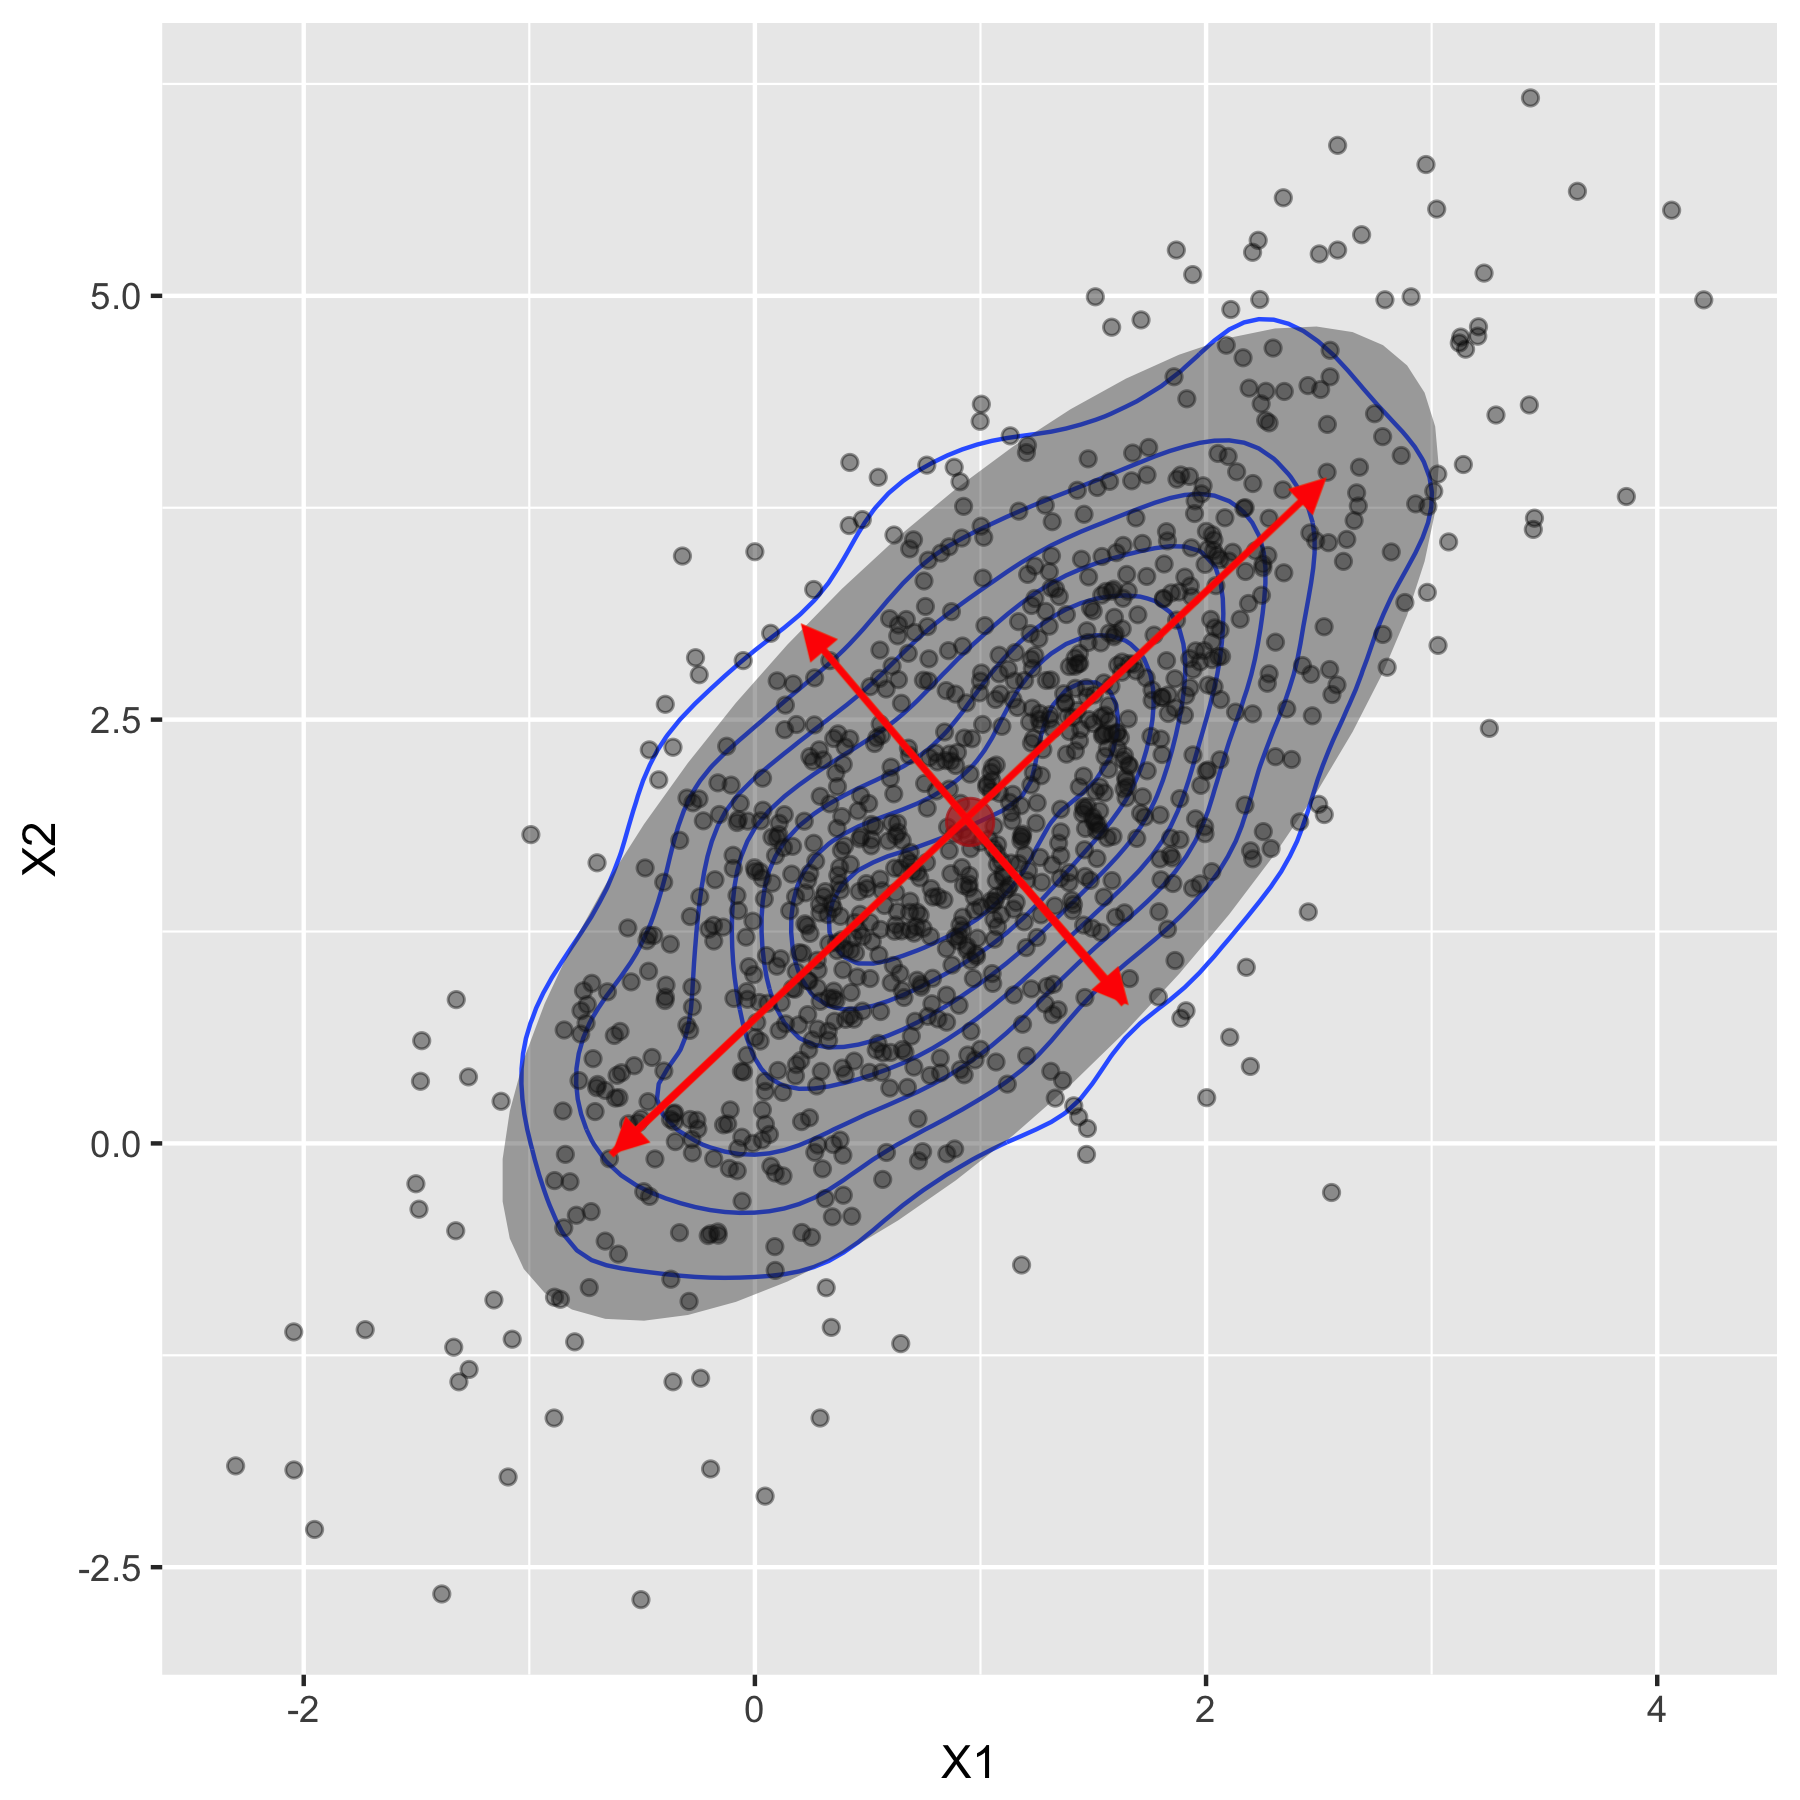
                                  平均ベクトル (0.95 1.89)

Rによる多変量確率分布

分散共分散行列はデータの広がりを表す

                                            分散 $1.02$

分散共分散行列 ${\begin{pmatrix} 1.02 & 0.97 \\ 0.97 & 2 \end{pmatrix}}$

Rによる多変量確率分布

平均の計算

colMeans(iris_raw[, 1:4])
Sepal.Length  Sepal.Width Petal.Length  Petal.Width 
        5.84         3.05         3.76         1.20

サブグループ別の平均を計算する関数

  • by()
  • aggregate()
Rによる多変量確率分布

byによるグループ平均の計算

by(data = iris[,1:4], INDICES = iris$Species, FUN = colMeans)
iris_raw$Species: setosa
Sepal.Length  Sepal.Width Petal.Length  Petal.Width 
       5.006        3.418        1.464        0.244 
 ----------------------------------------------------
iris_raw$Species: versicolor
Sepal.Length  Sepal.Width Petal.Length  Petal.Width 
       5.936        2.770        4.260        1.326 
 ----------------------------------------------------
iris_raw$Species: virginica
Sepal.Length  Sepal.Width Petal.Length  Petal.Width 
       6.588        2.974        5.552        2.026
Rによる多変量確率分布

aggregateによるグループ平均の計算

aggregate(. ~ Species, iris_raw, mean)
     Species Sepal.Length Sepal.Width Petal.Length Petal.Width
1     setosa         5.01        3.42         1.46       0.244
2 versicolor         5.94        2.77         4.26       1.326
3  virginica         6.59        2.97         5.55       2.026
Rによる多変量確率分布

分散共分散行列と相関行列の計算

var(iris_raw[, 1:4])
             Sepal.Length Sepal.Width Petal.Length Petal.Width
Sepal.Length       0.6857     -0.0393        1.274       0.517
Sepal.Width       -0.0393      0.1880       -0.322      -0.118
Petal.Length       1.2737     -0.3217        3.113       1.296
Petal.Width        0.5169     -0.1180        1.296       0.582

相関

cor(iris_raw[, 1:4])
             Sepal.Length Sepal.Width Petal.Length Petal.Width
Sepal.Length        1.000      -0.109        0.872       0.818
Sepal.Width        -0.109       1.000       -0.421      -0.357
Petal.Length        0.872      -0.421        1.000       0.963
Petal.Width         0.818      -0.357        0.963       1.000
Rによる多変量確率分布

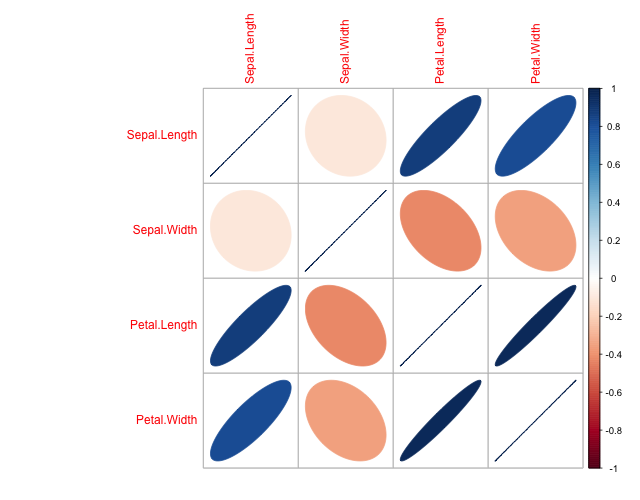
相関行列の可視化

corrplot関数による相関プットの可視化

corrplot(cor(iris_raw[, 1:4]), method = "ellipse")
Rによる多変量確率分布

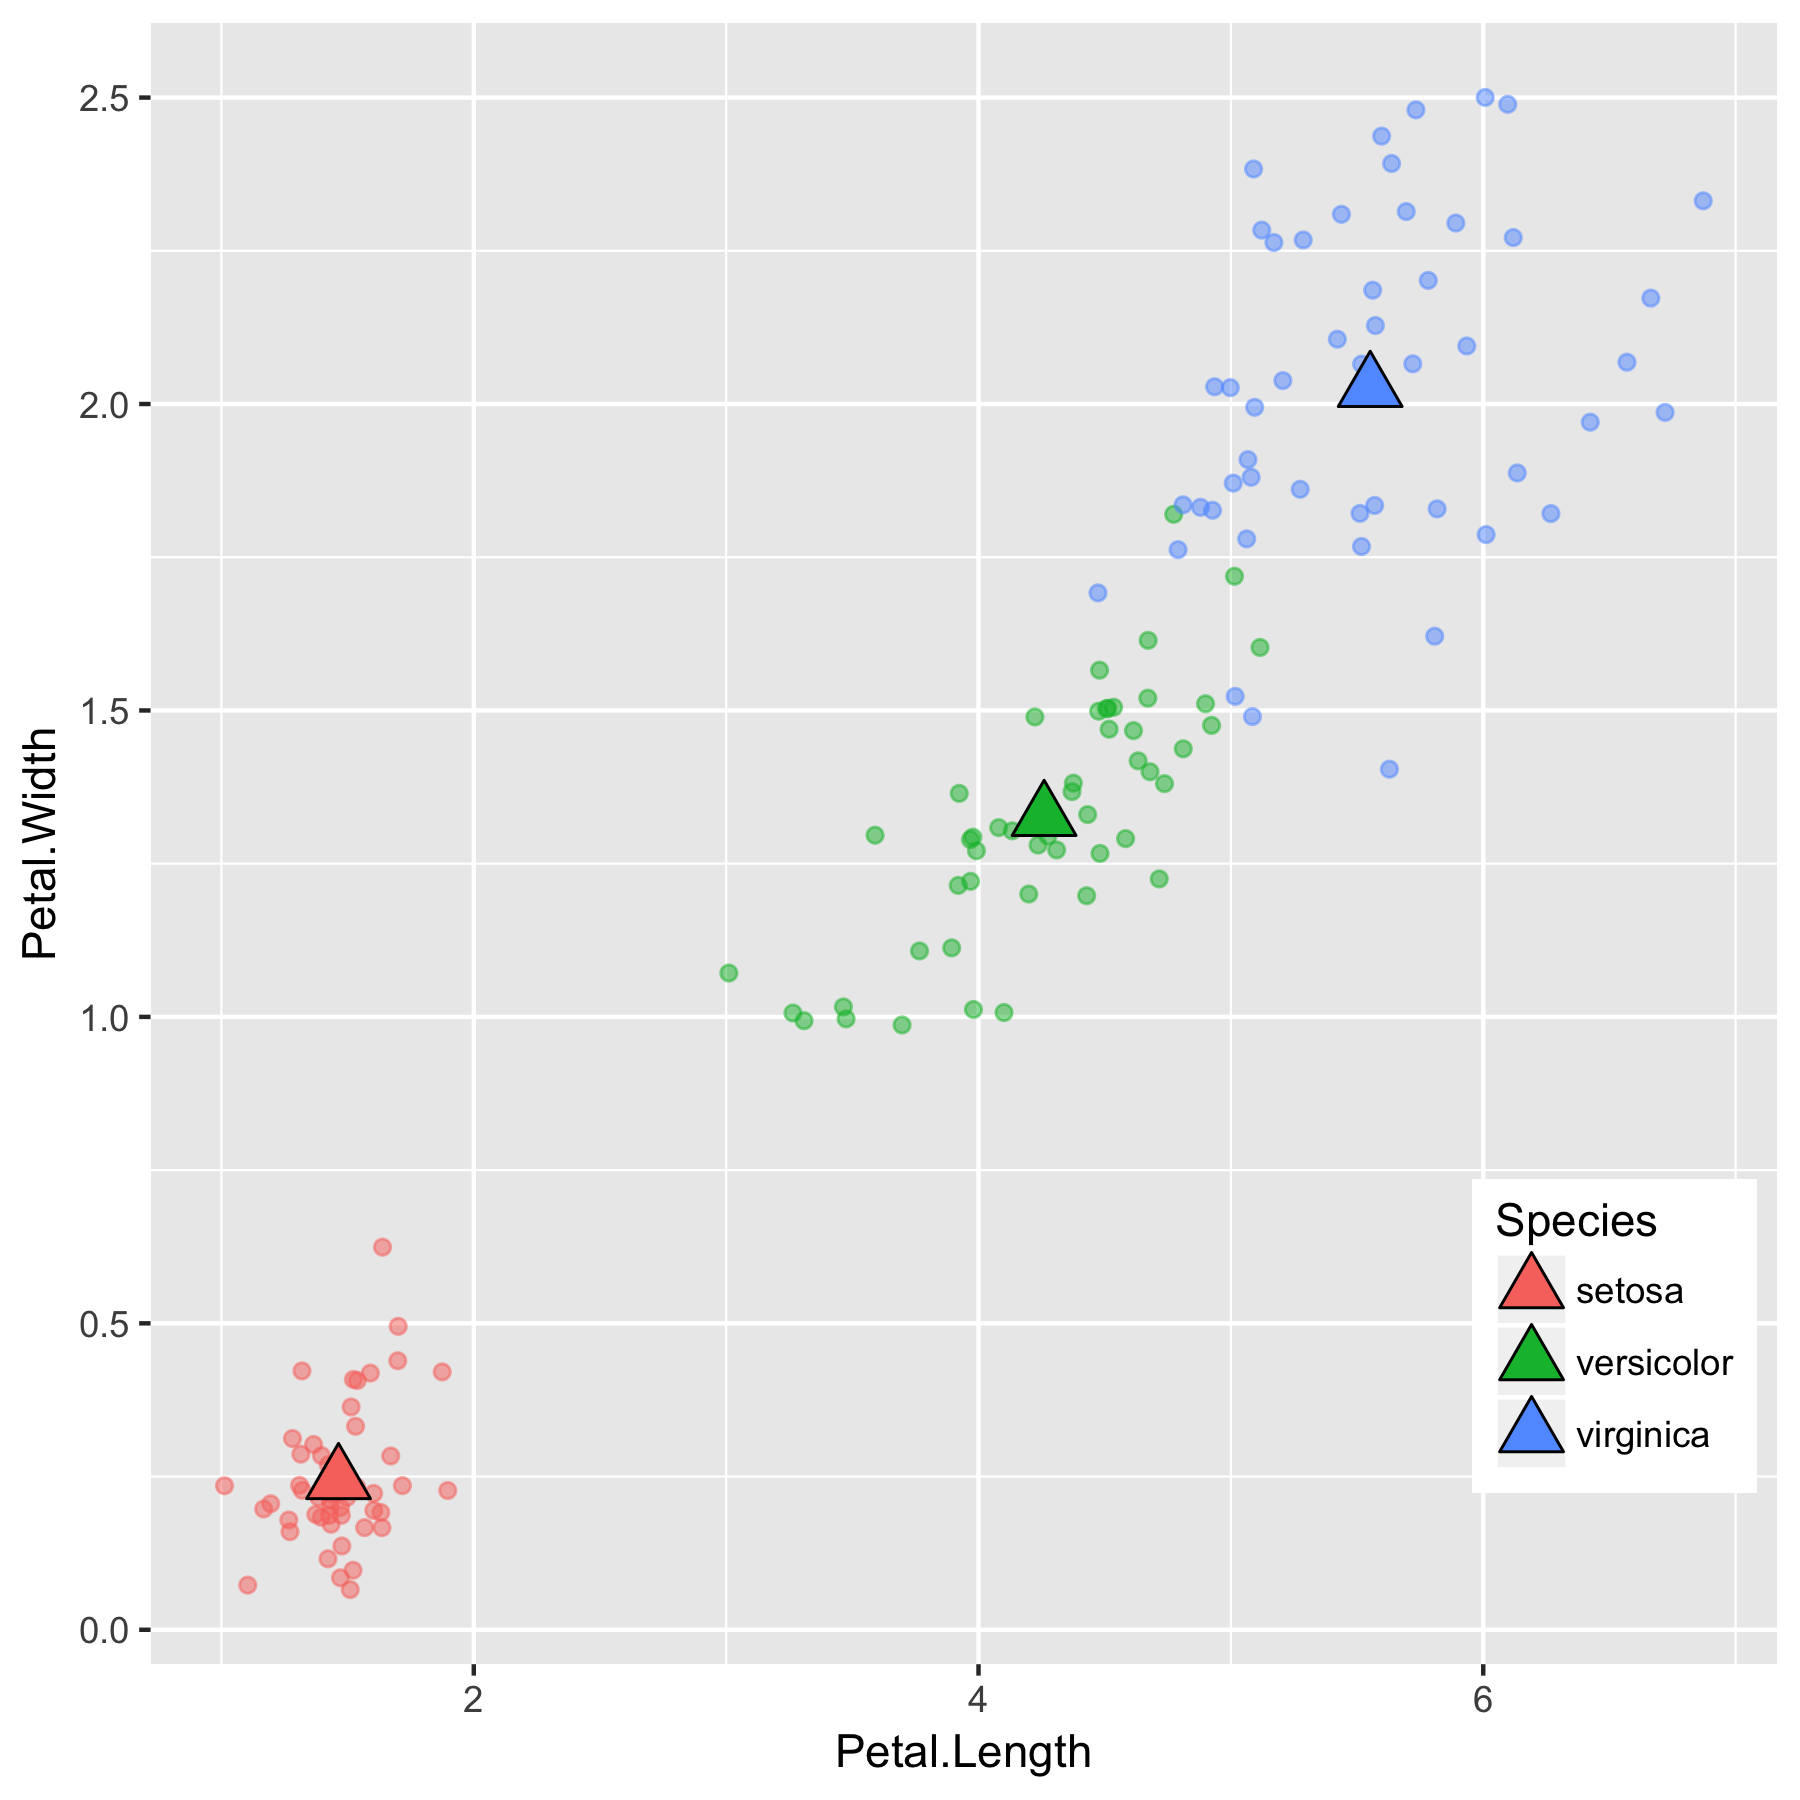
平均値の解釈

平均値

Species Petal.Length Petal.Width
setosa 1.46 0.244
versicolor 4.26 1.326
virginica 5.55 2.026

平均

Rによる多変量確率分布

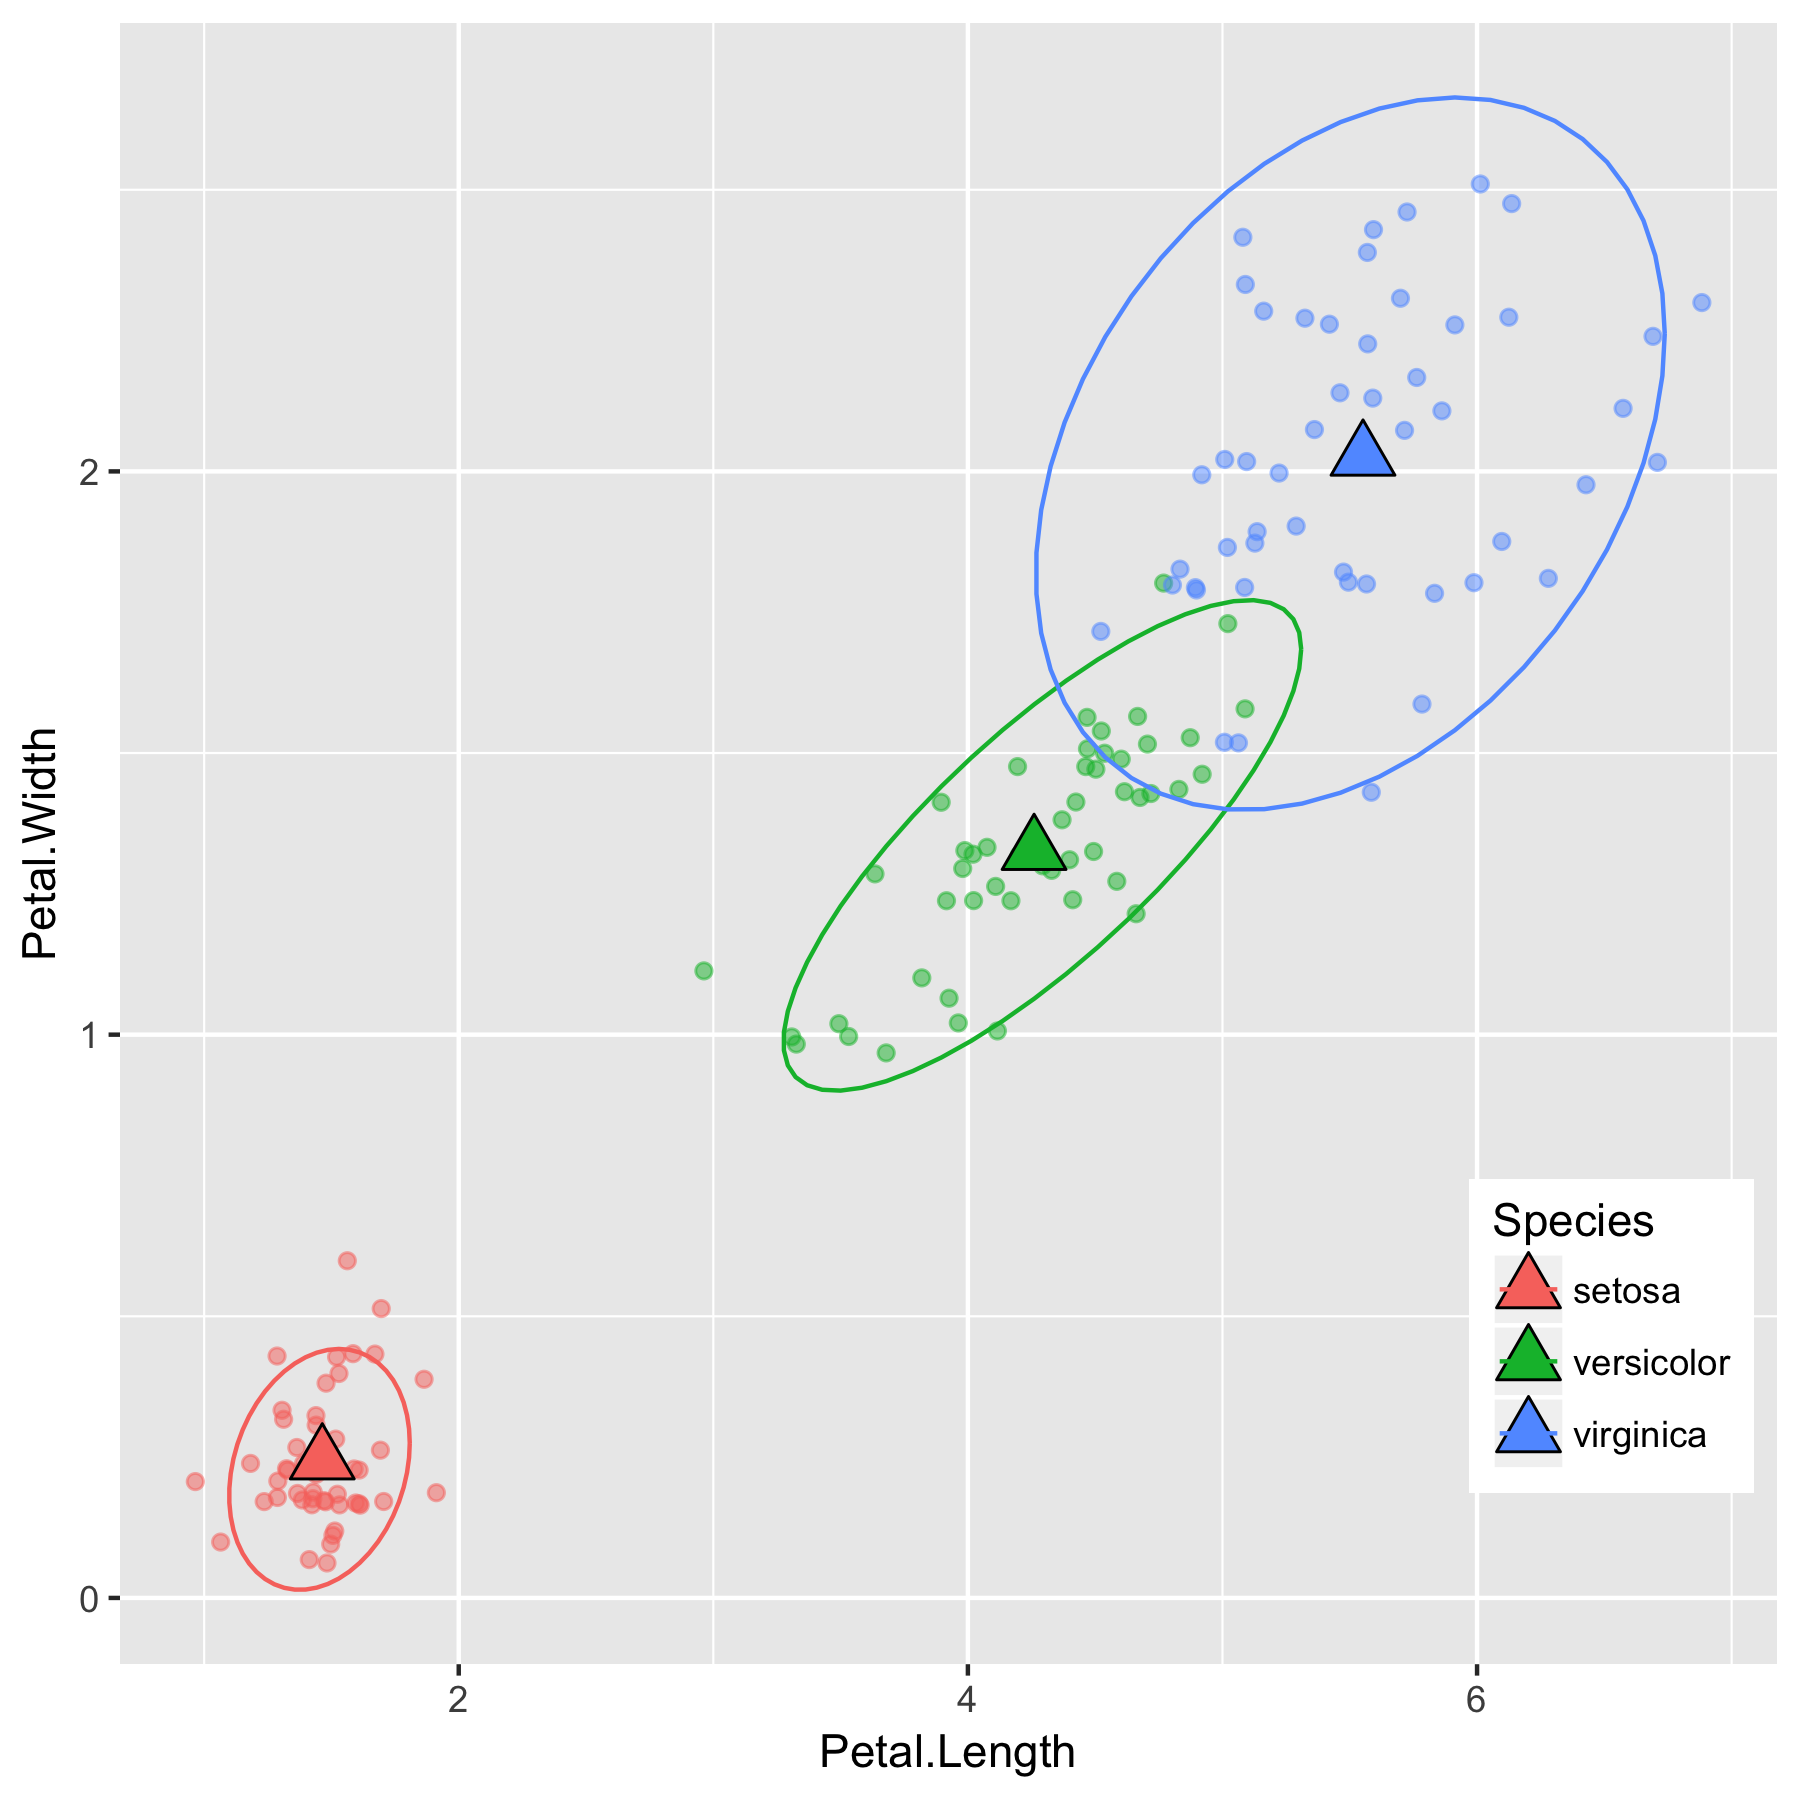
分散の解釈

setosa Petal.Length Petal.Width
Petal.Length 0.030 0.006
Petal.Width 0.006 0.011
versicolor Petal.Length Petal.Width
Petal.Length 0.221 0.073
Petal.Width 0.073 0.039
virginica Petal.Length Petal.Width
Petal.Length 0.305 0.049
Petal.Width 0.049 0.075

平均と分散

Rによる多変量確率分布

練習しましょう!

Rによる多変量確率分布

Preparing Video For Download...