R で学ぶ中級インタラクティブ可視化(plotly)
Adam Loy
Statistician, Carleton College
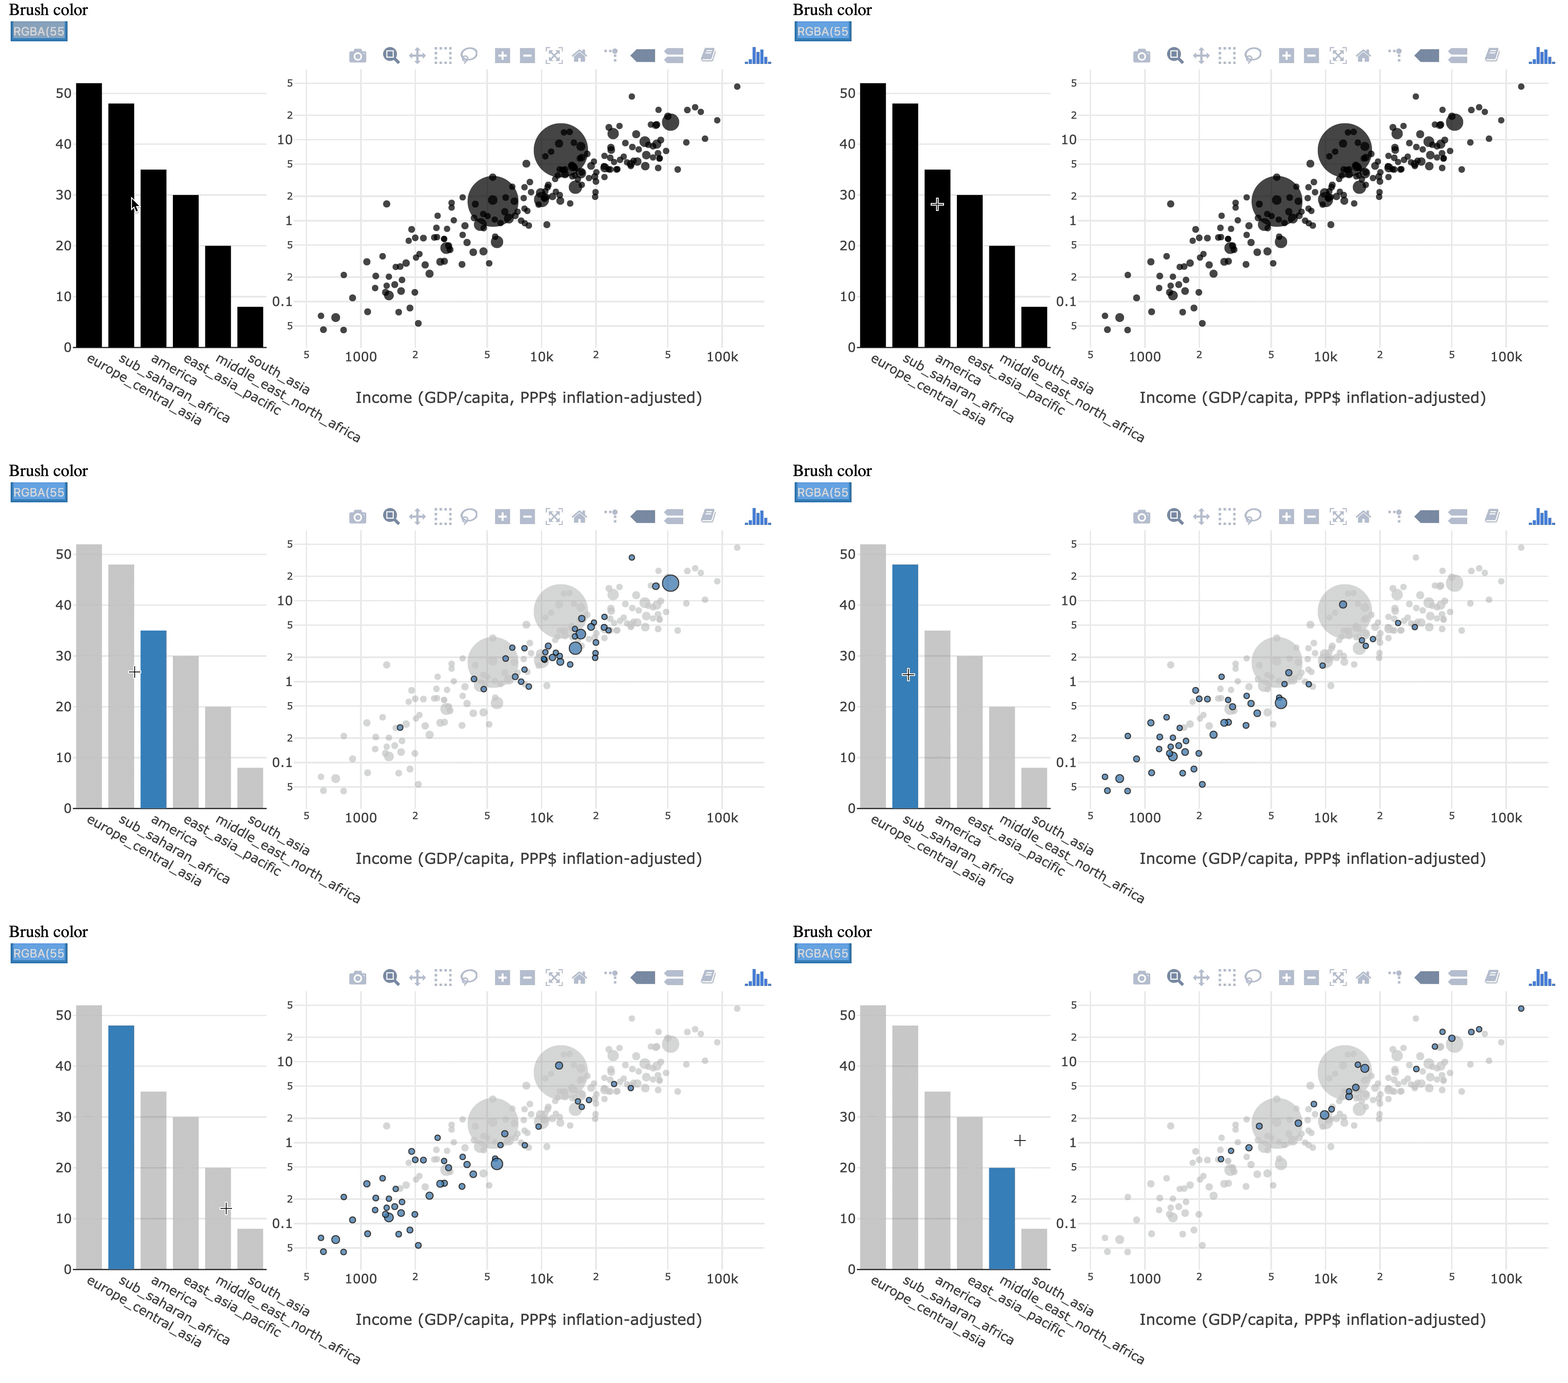
一時的な選択
前に選んだケースは保持されない

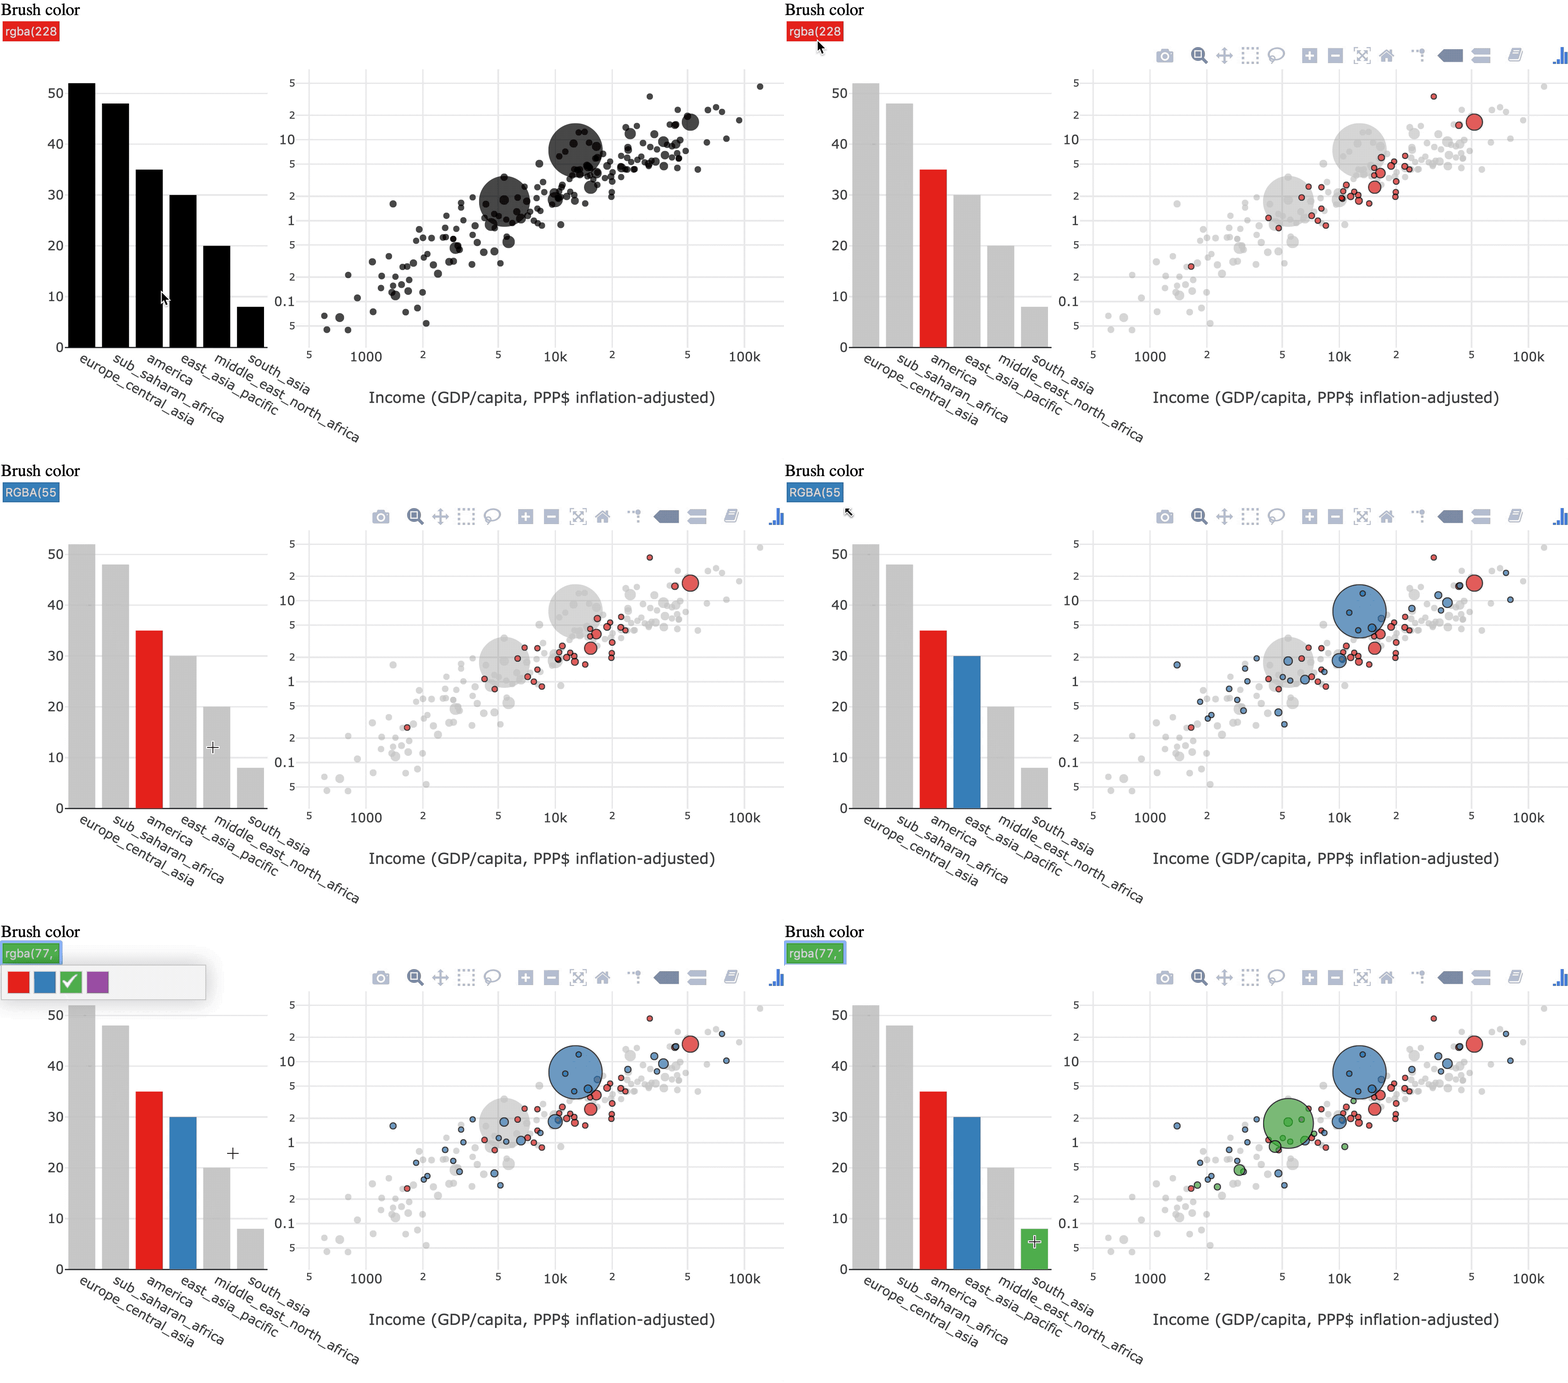
永続的な選択
選択が蓄積される


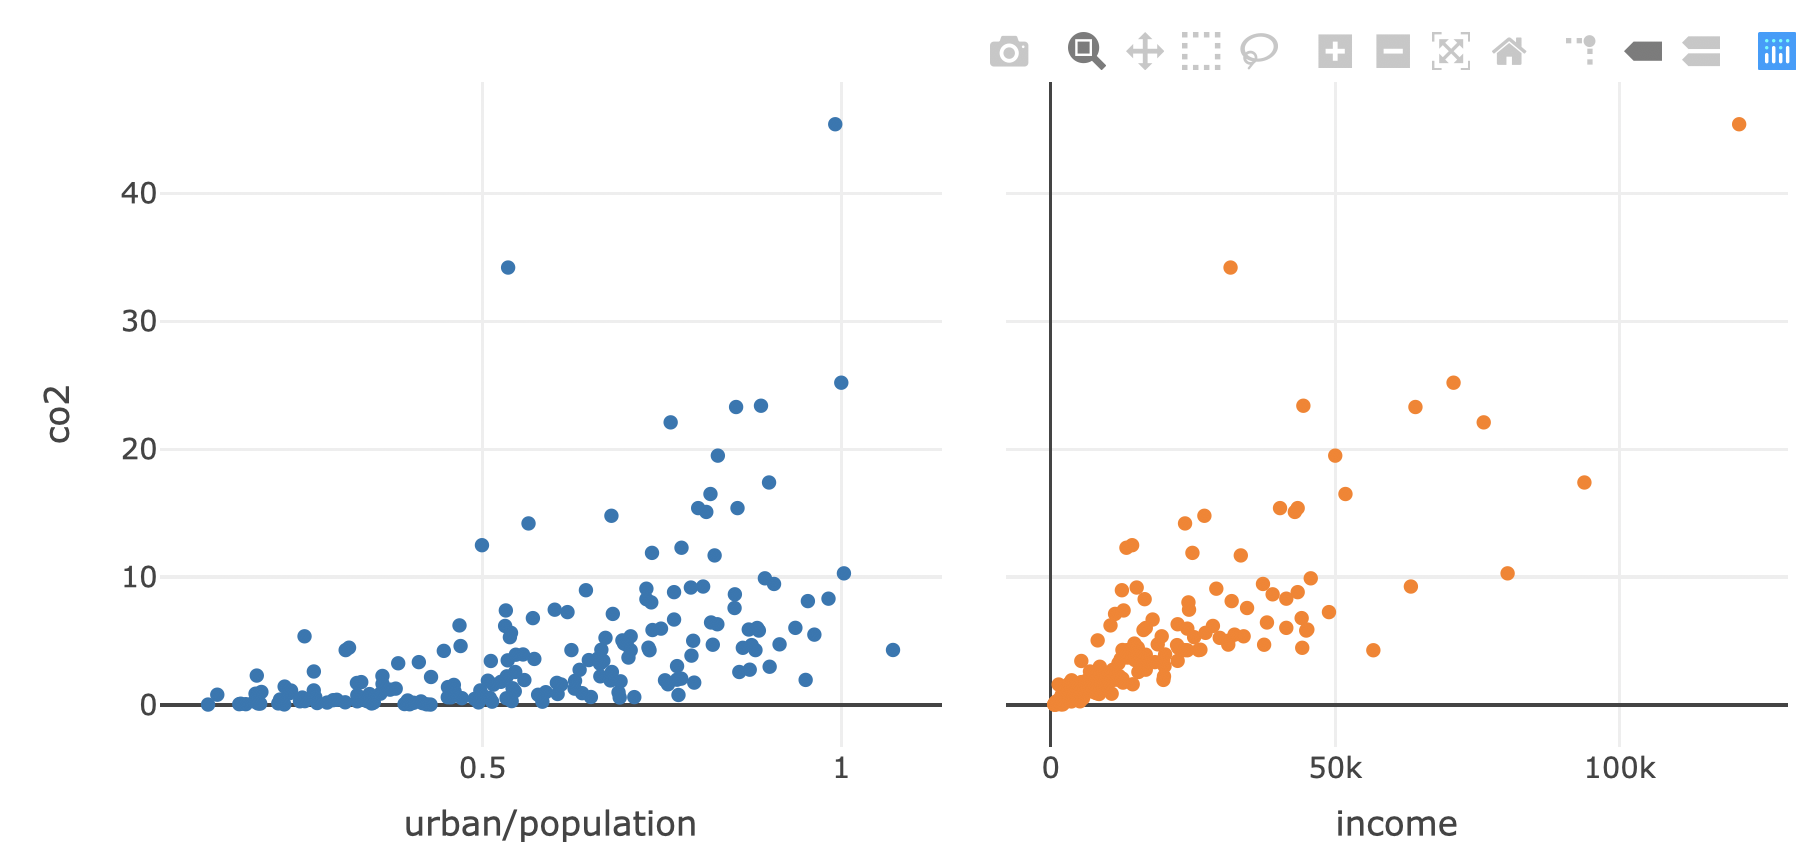
shared_data <- world2014 %>% SharedData$new()
p1 <- shared_data %>%
plot_ly(x=~urban/population, y = ~co2, text = ~country) %>%
add_markers()
p2 <- shared_data %>%
plot_ly(x=~income, y = ~co2, text = ~country) %>%
add_markers()
subplot(p1, p2, titleX = TRUE, shareY = TRUE) %>%
hide_legend()
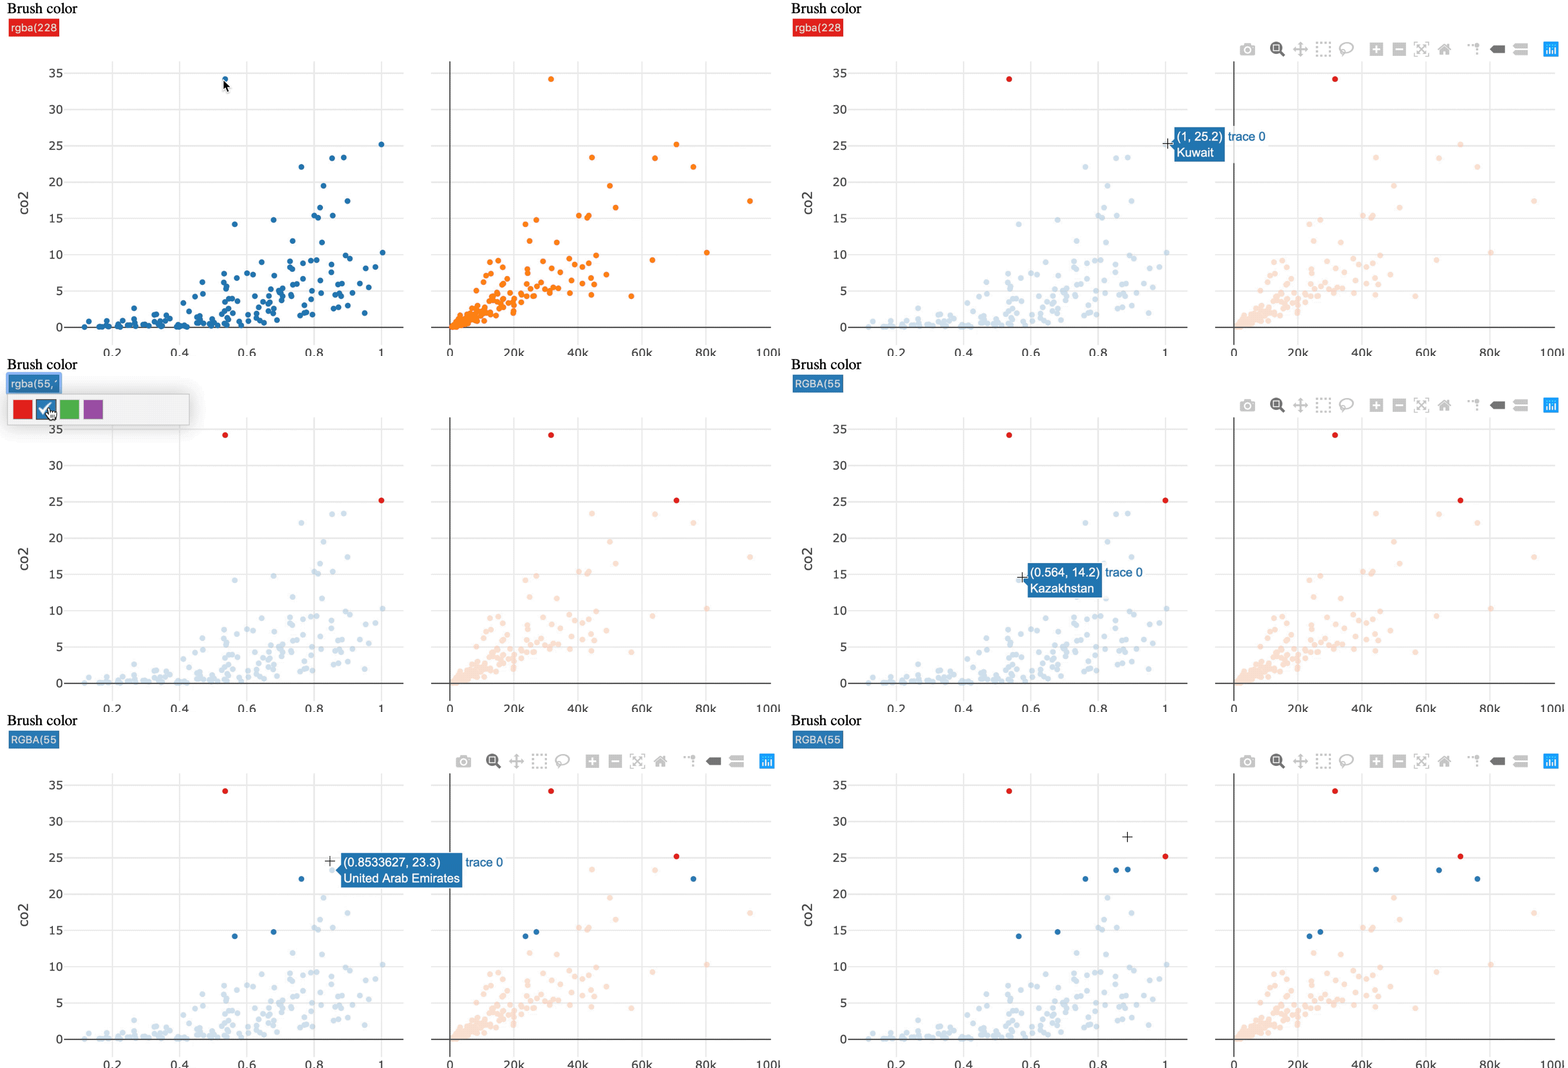
highlight() で永続的な選択を有効化
subplot(p1, p2, titleX = TRUE, shareY = TRUE) %>%
hide_legend() %>%
highlight(persistent = TRUE)
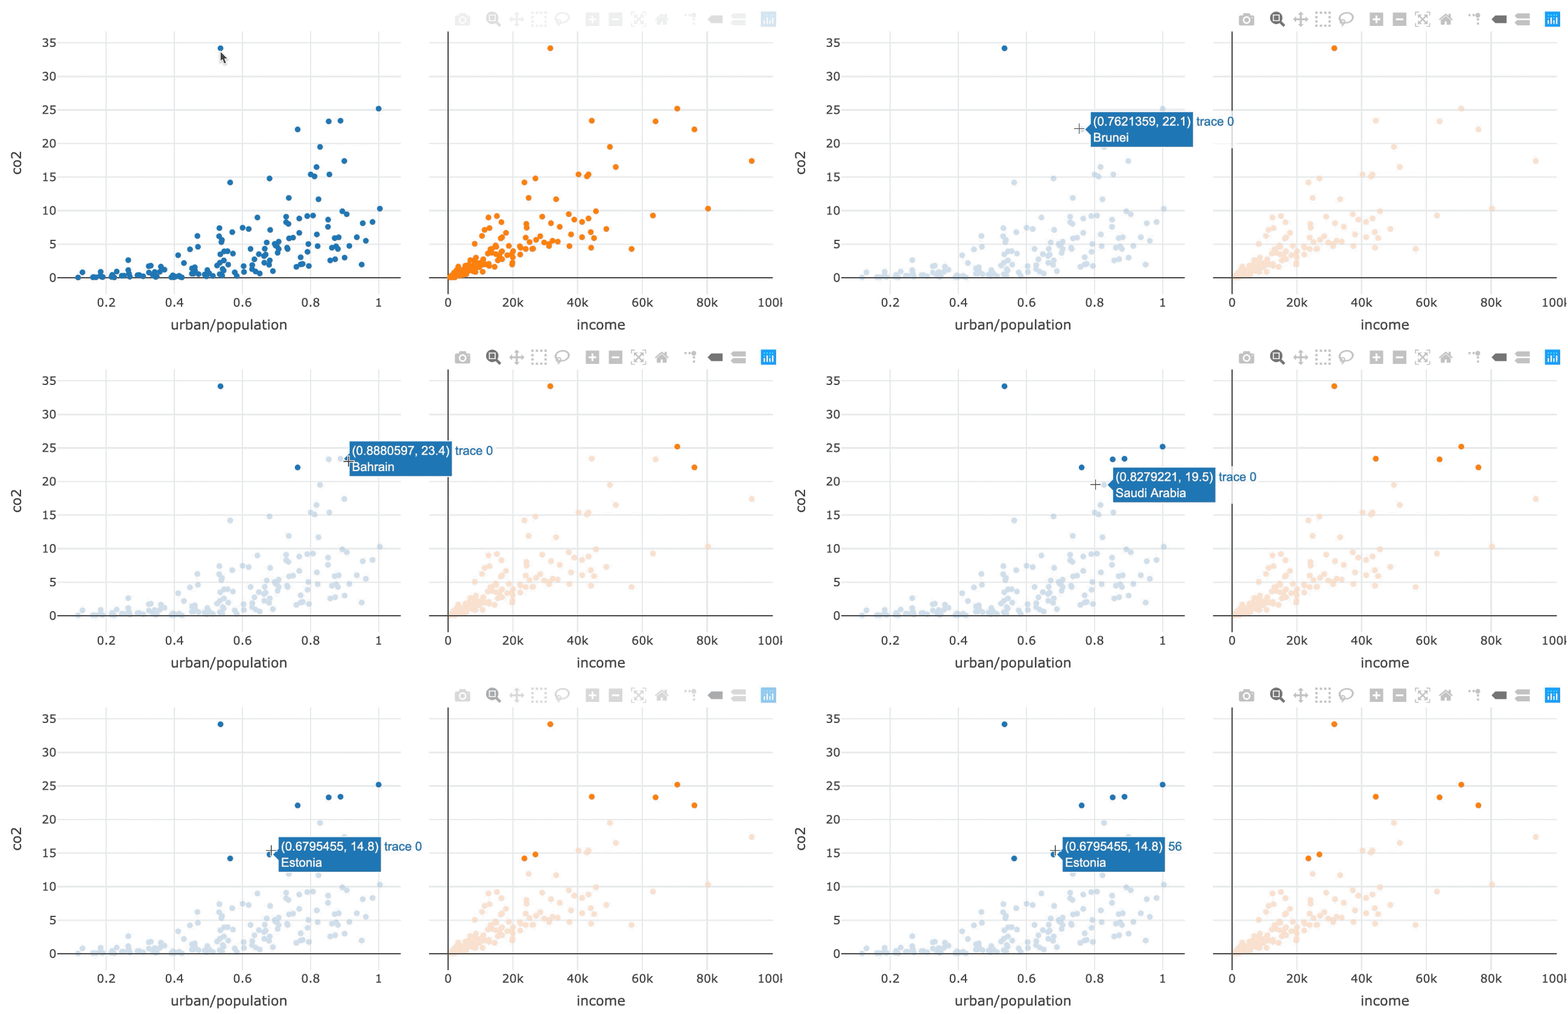

カラー ピッカーを有効にするには dynamic = TRUE を追加
subplot(p1, p2, titleX = TRUE, shareY = TRUE) %>%
hide_legend() %>%
highlight(persistent = TRUE, dynamic = TRUE)
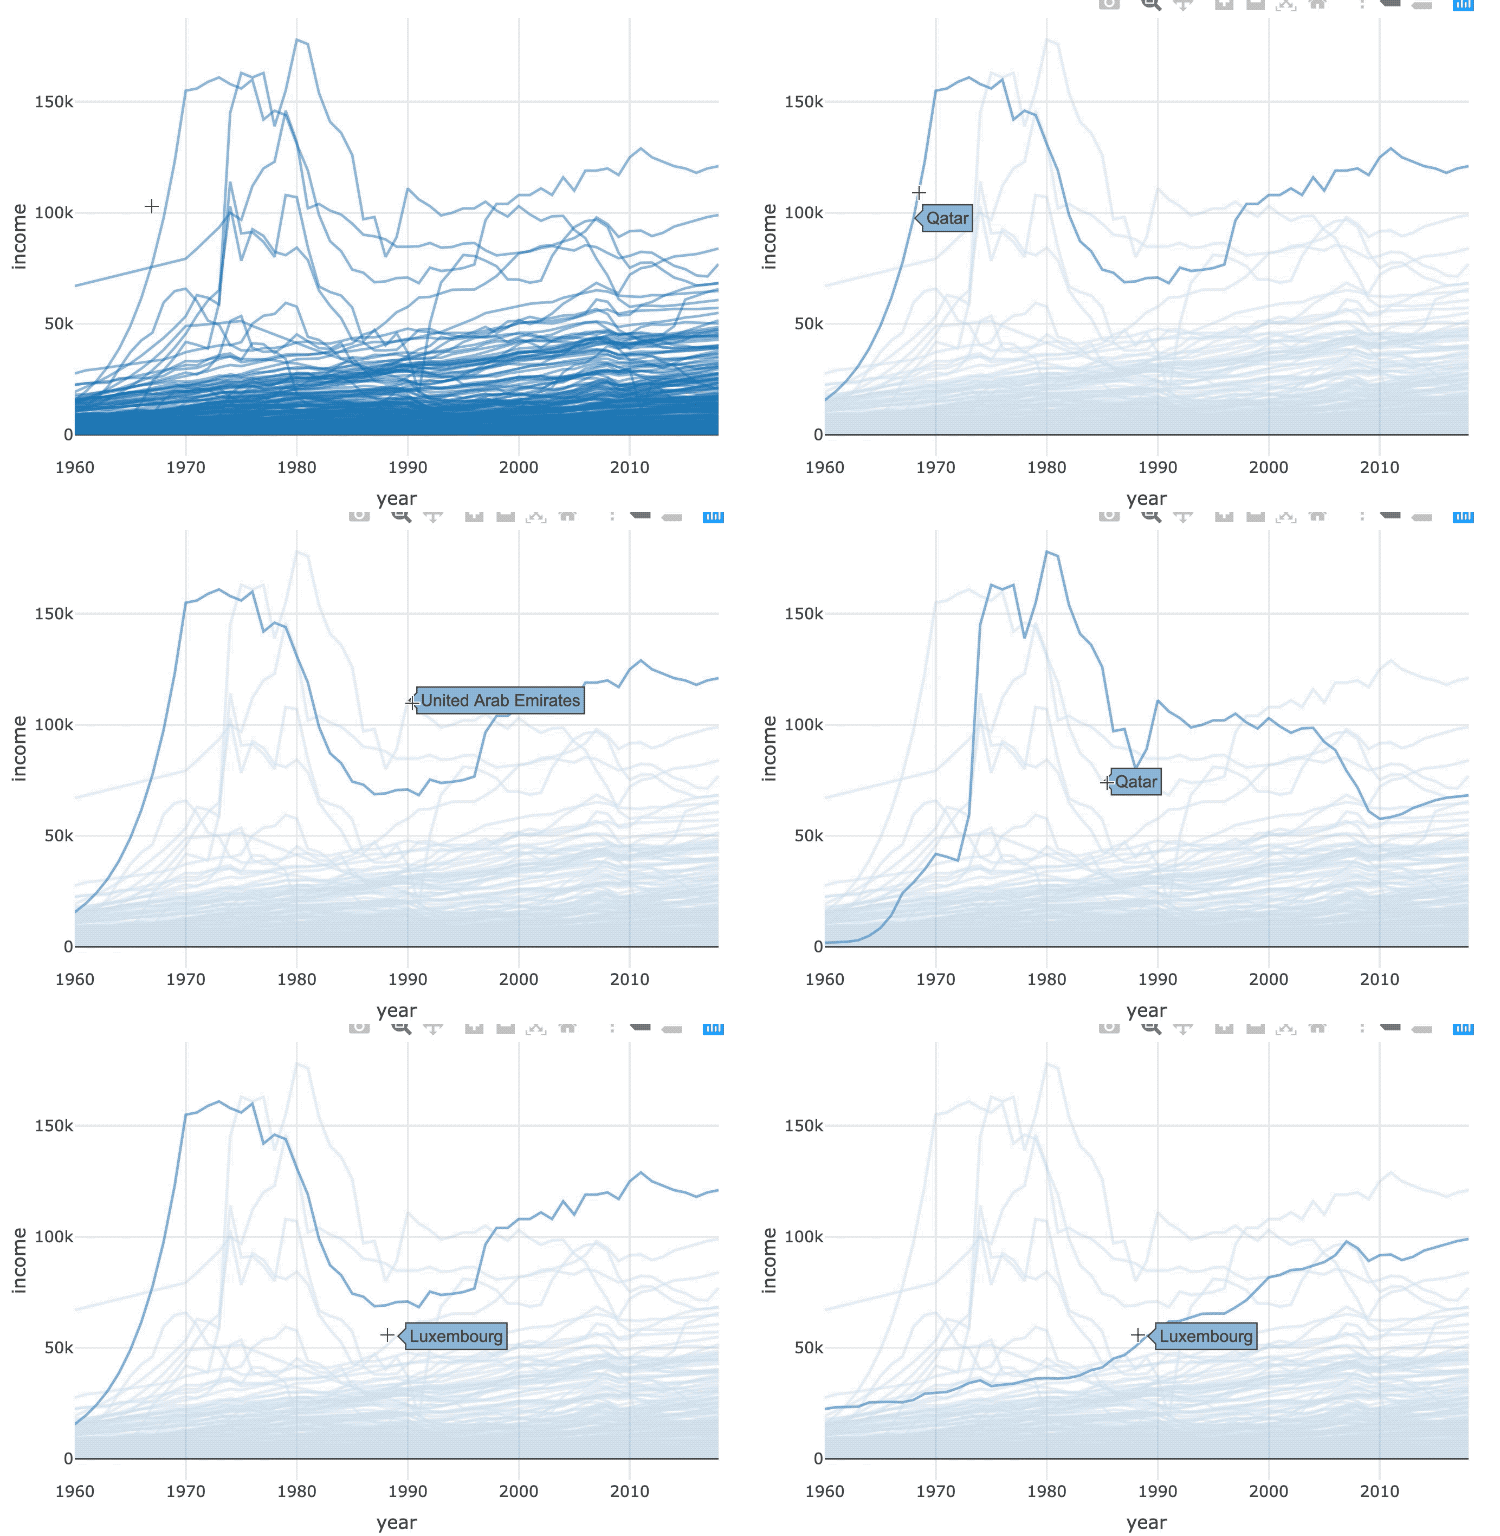
直接操作
グラフ要素との対話で選択

間接操作
チャート外のクエリで選択


world_indicators %>%
SharedData$new(key = ~country) %>%
plot_ly(x = ~year, y = ~income, alpha = 0.5) %>%
group_by(country) %>%
add_lines()
world_indicators %>%
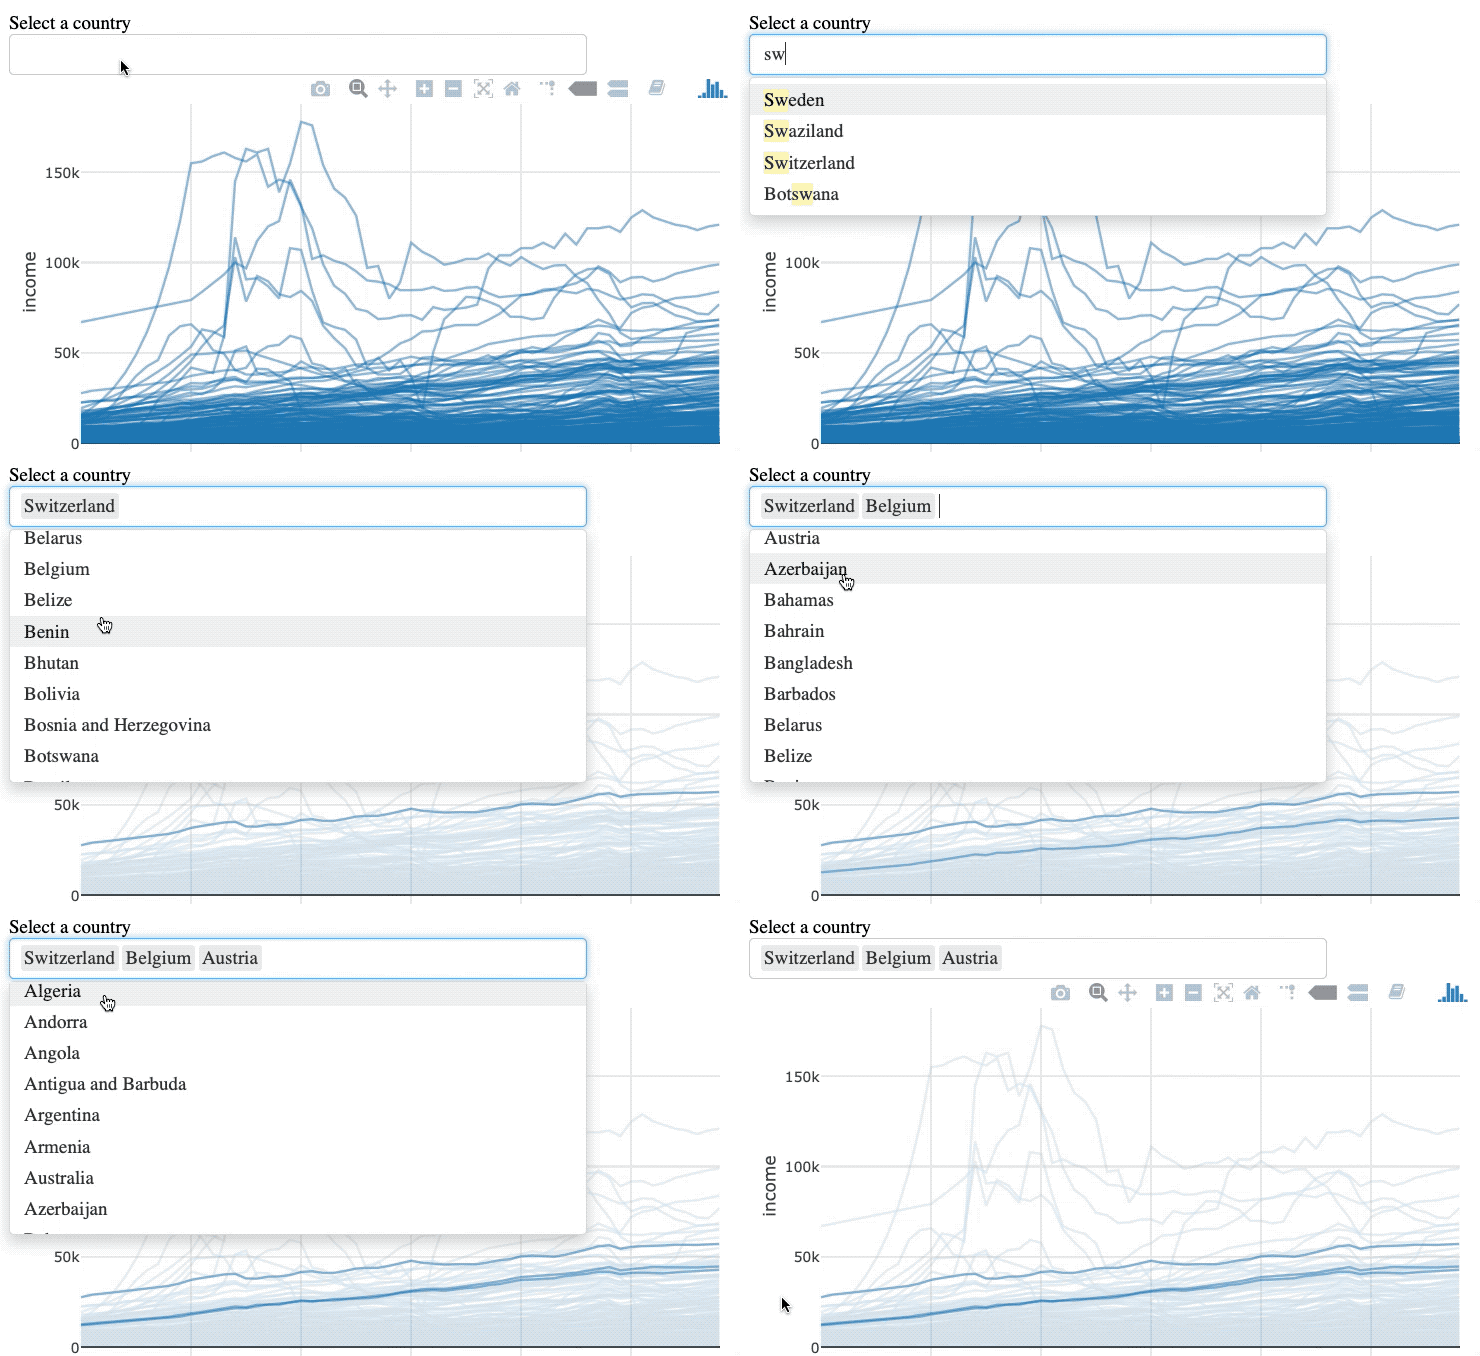
SharedData$new(key = ~country, group = "Select a country") %>%
plot_ly(x = ~year, y = ~income, alpha = 0.5) %>%
group_by(country) %>%
add_lines() %>%
highlight(selectize = TRUE)

R で学ぶ中級インタラクティブ可視化(plotly)