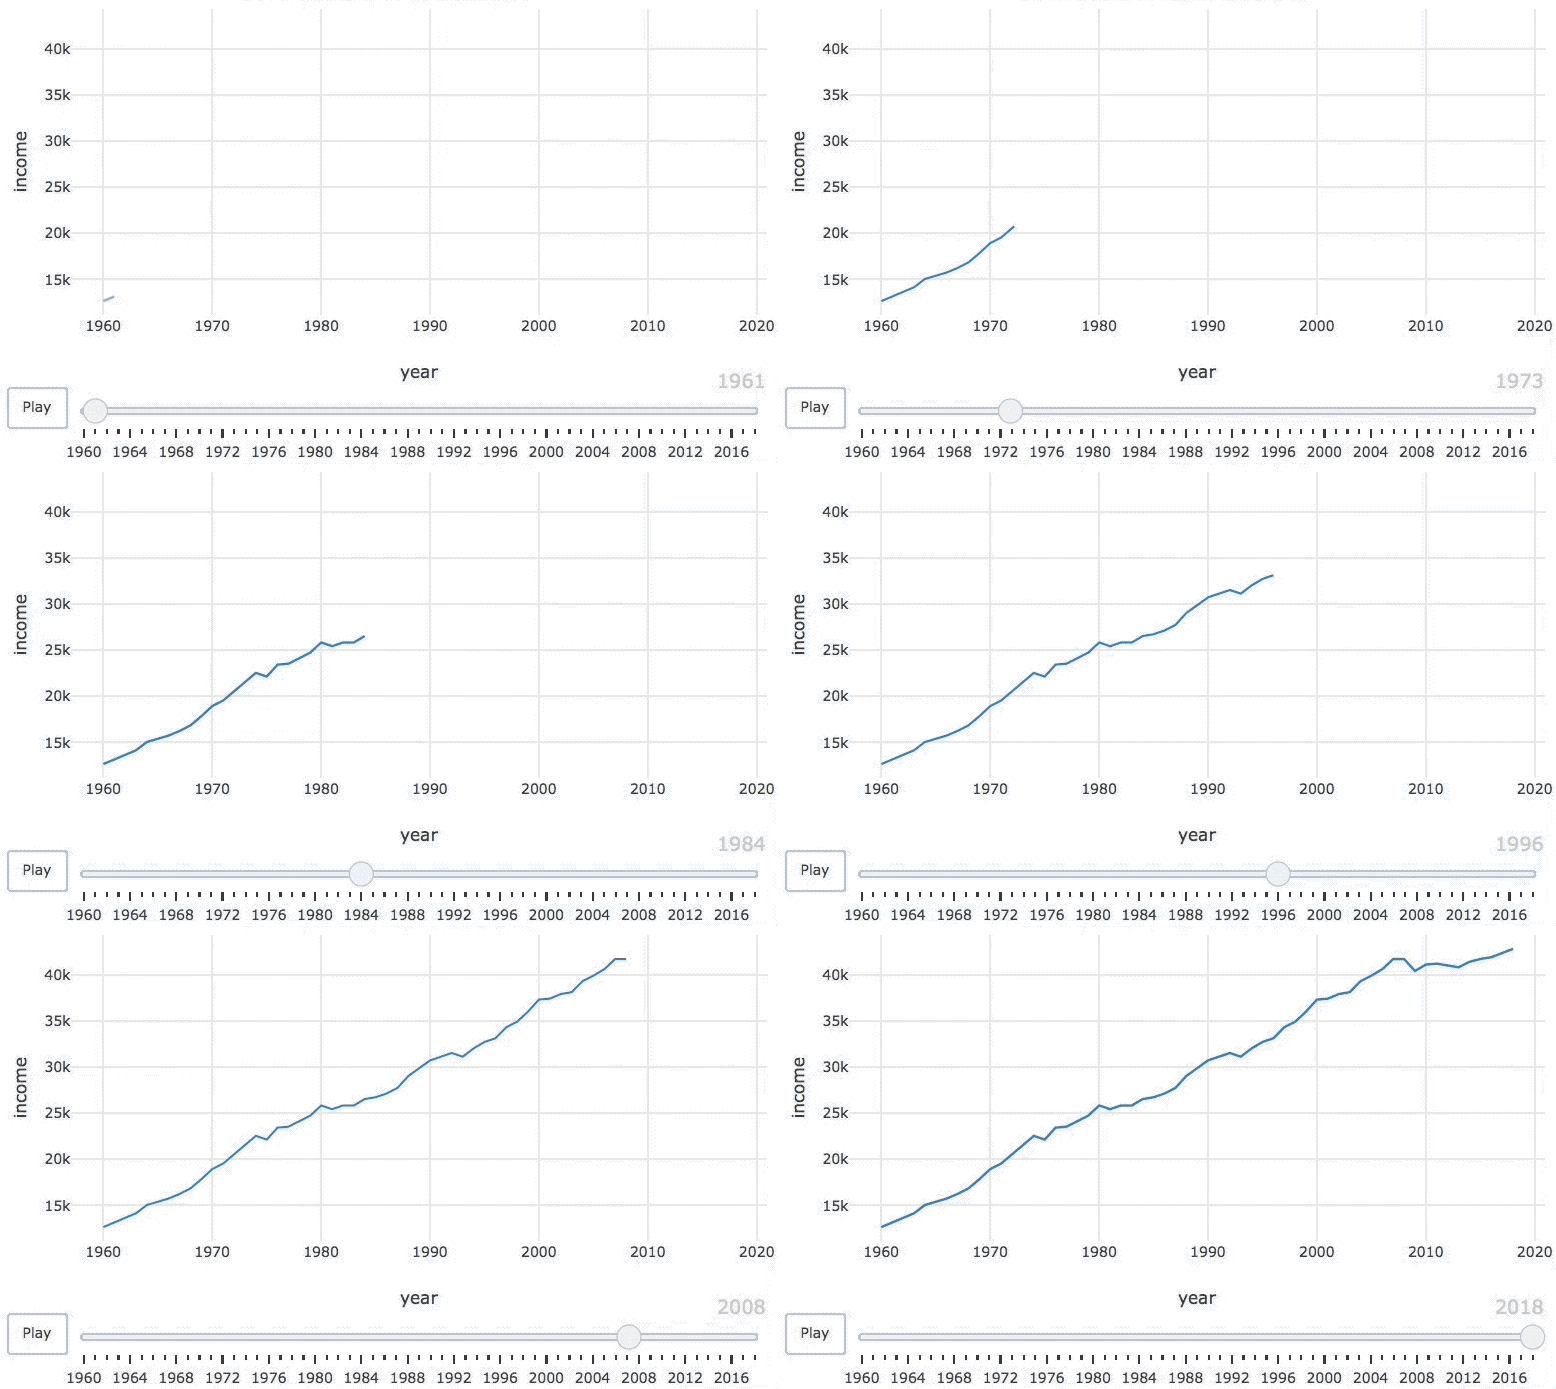
累積アニメーション

R で学ぶ中級インタラクティブ可視化(plotly)

Adam Loy

Statistician, Carleton College
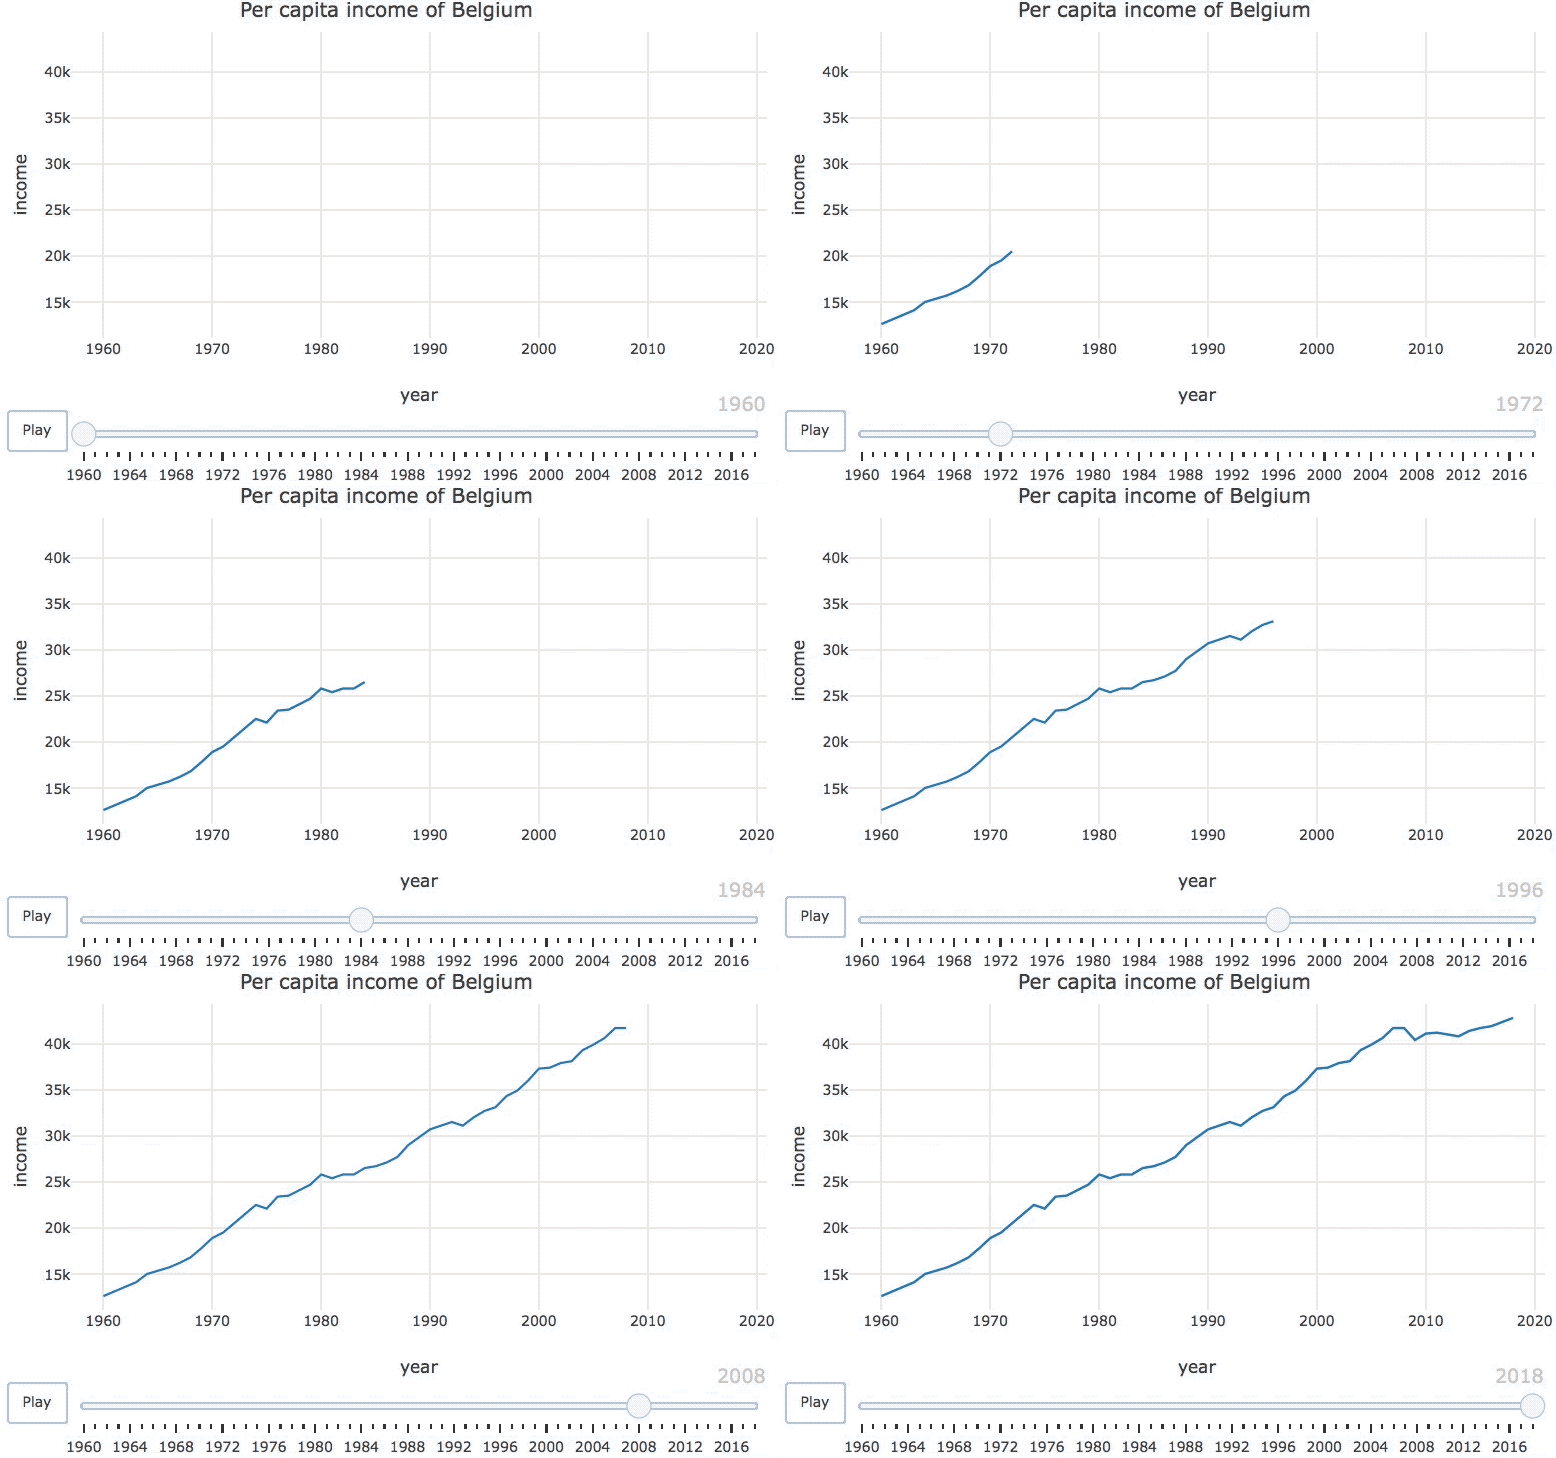
ベルギーの一人当たり所得の時系列アニメーション。

R で学ぶ中級インタラクティブ可視化(plotly)

ベルギーの所得データ

belgium <- world_indicators %>%
  filter(country == "Belgium")
belgium
# A tibble: 59 x 11
  country  year income   co2 military population  urban life_expectancy four_regions
  <chr>   <dbl>  <dbl> <dbl>    <dbl>      <dbl>  <dbl>           <dbl> <chr>       
1 Belgium  1960  12600  9.93     3.4     9170000 8.46e6            69.6 europe      
2 Belgium  1961  13100 10.1      3.26    9230000 8.50e6            70.5 europe      
3 Belgium  1962  13700 10.6      3.28    9280000 8.55e6            70.2 europe      
4 Belgium  1963  14100 11.3      3.22    9340000 8.62e6            70   europe      
5 Belgium  1964  15000 11        3.21    9390000 8.72e6            70.7 europe      
# … with 54 more rows, and 2 more variables: eight_regions <chr>, six_regions <chr>
R で学ぶ中級インタラクティブ可視化(plotly)

フレームとは?

# A tibble: 59 x 11
  country  year income   co2
  <chr>   <dbl>  <dbl> <dbl>
1 Belgium  1960  12600  9.93
2 Belgium  1961  13100 10.1 
3 Belgium  1962  13700 10.6 
4 Belgium  1963  14100 11.3 
5 Belgium  1964  15000 11   
6 Belgium  1965  15300 11.2 
# … with 53 more rows, and 7
#   more variables

frame = ~year はどうなる?

R で学ぶ中級インタラクティブ可視化(plotly)

フレームとは?

目標 フレーム間で情報を保持する例

frame = ~year frame = ~year を設定するとデータは保持されない。

R で学ぶ中級インタラクティブ可視化(plotly)

データセットの累積

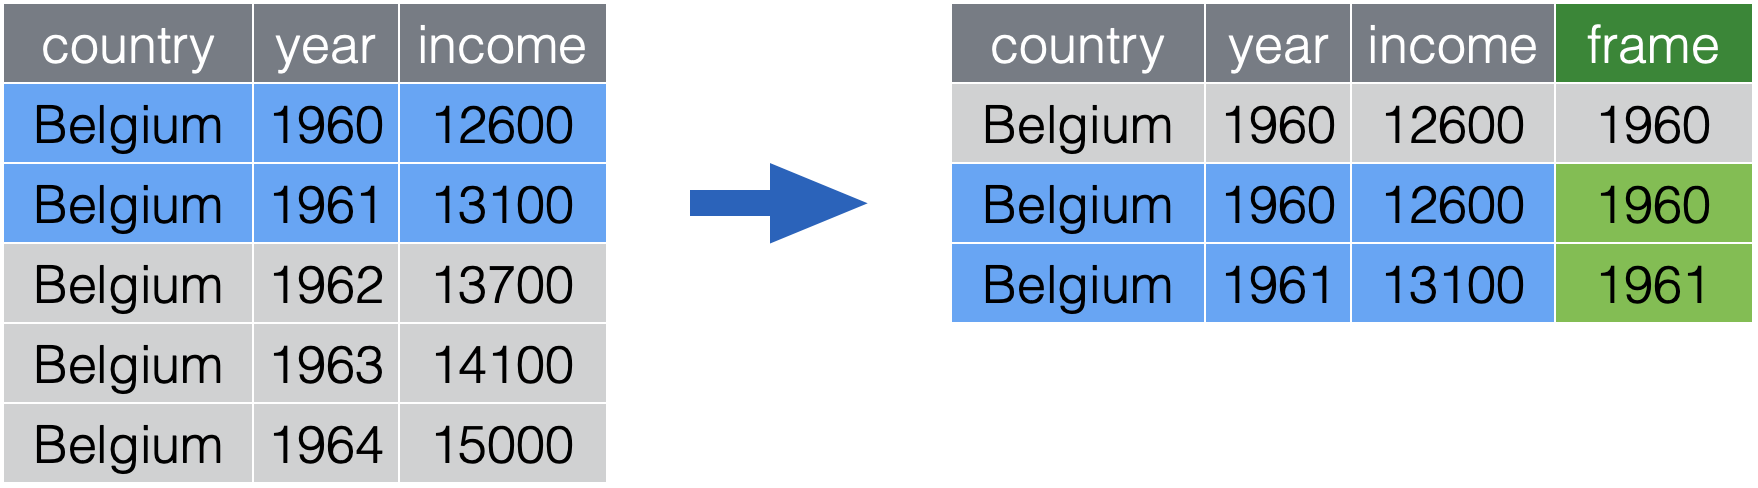
1960年の累積データフレーム。

R で学ぶ中級インタラクティブ可視化(plotly)

データセットの累積

1961年の累積データフレーム。

R で学ぶ中級インタラクティブ可視化(plotly)

データセットの累積

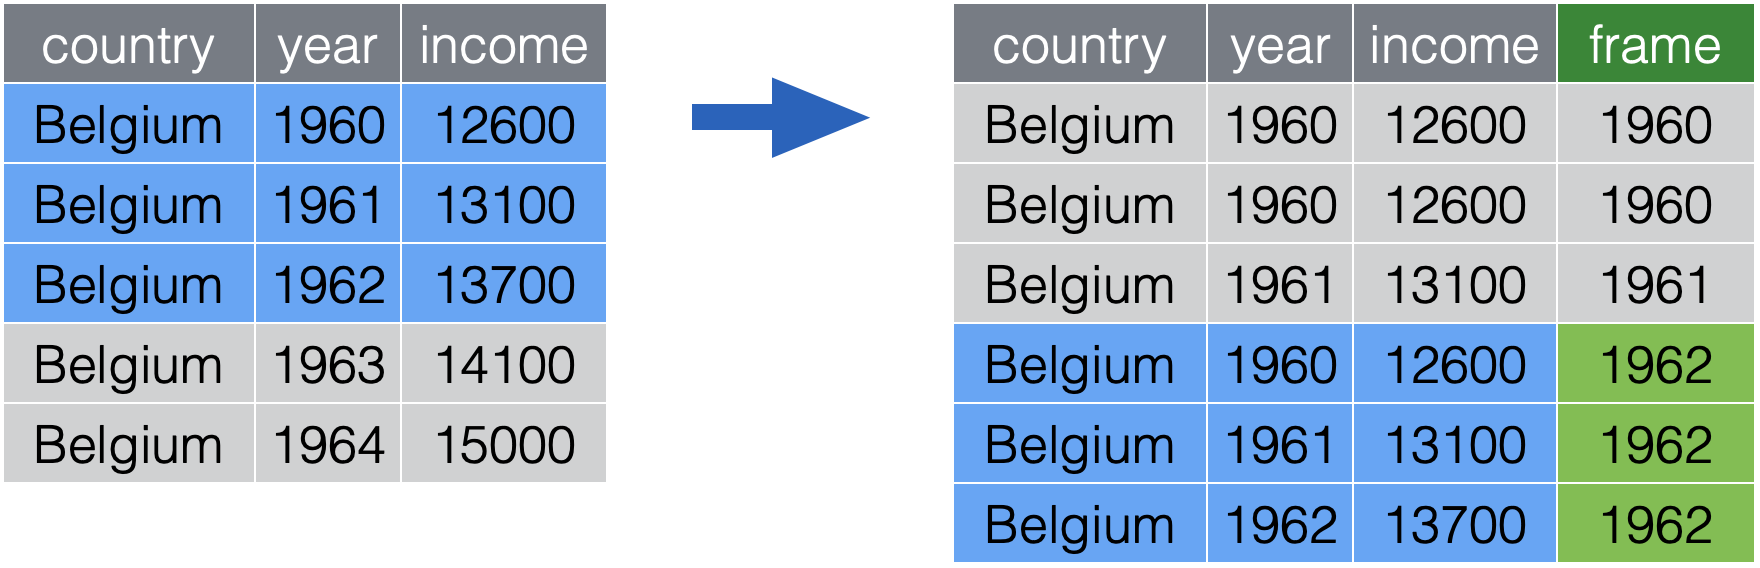
1962年までの累積データフレーム。

R で学ぶ中級インタラクティブ可視化(plotly)

split()

library(dplyr)
library(purrr)

belgium %>% split(.$year)

year でデータセットを分割し、data.frame のリストにする

R で学ぶ中級インタラクティブ可視化(plotly)

accumulate()

library(dplyr)
library(purrr)
belgium %>%
  split(.$year) %>%
  accumulate(~bind_rows(.x, .y)) 

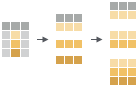
単一行の data.frame を再帰的に結合する図。

R で学ぶ中級インタラクティブ可視化(plotly)

名前を付ける

library(dplyr)
library(purrr)
belgium %>%
  split(.$year) %>%
  accumulate(~bind_rows(.x, .y)) %>%
  set_names(1960:2018) 

単一行の data.frame を再帰的に結合する図。

R で学ぶ中級インタラクティブ可視化(plotly)

結合

library(dplyr)
library(purrr)
belgium %>%
  split(.$year) %>%
  accumulate(~bind_rows(.x, .y)) %>%
  set_names(1960:2018) %>%
  bind_rows(.id = "frame")

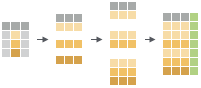
data.frame のリストを行方向に結合する図。

R で学ぶ中級インタラクティブ可視化(plotly)
# A tibble: 1,770 x 12
   frame country  year income   co2 military population  urban life_expectancy
   <chr> <chr>   <dbl>  <dbl> <dbl>    <dbl>      <dbl>  <dbl>           <dbl>
 1 1960  Belgium  1960  12600  9.93     3.4     9170000 8.46e6            69.6
 2 1961  Belgium  1960  12600  9.93     3.4     9170000 8.46e6            69.6
 3 1961  Belgium  1961  13100 10.1      3.26    9230000 8.50e6            70.5
 4 1962  Belgium  1960  12600  9.93     3.4     9170000 8.46e6            69.6
 5 1962  Belgium  1961  13100 10.1      3.26    9230000 8.50e6            70.5
 6 1962  Belgium  1962  13700 10.6      3.28    9280000 8.55e6            70.2
 7 1963  Belgium  1960  12600  9.93     3.4     9170000 8.46e6            69.6
 8 1963  Belgium  1961  13100 10.1      3.26    9230000 8.50e6            70.5
 9 1963  Belgium  1962  13700 10.6      3.28    9280000 8.55e6            70.2
10 1963  Belgium  1963  14100 11.3      3.22    9340000 8.62e6            70  
# … with 1,760 more rows, and 3 more variables: four_regions <chr>,
#   eight_regions <chr>, six_regions <chr>
R で学ぶ中級インタラクティブ可視化(plotly)

アニメーション化

library(dplyr)
library(purrr)
belgium %>%
  split(.$year) %>%
  accumulate(~bind_rows(.x, .y)) %>%
  set_names(1960:2018) %>%
  bind_rows(.id = "frame") %>%
  plot_ly(x = ~year, y = ~income) %>%
  add_lines(
    frame = ~frame, showlegend = FALSE
  )

ベルギーの一人当たり所得の経年アニメーション。

R で学ぶ中級インタラクティブ可視化(plotly)

Passons à la pratique !

R で学ぶ中級インタラクティブ可視化(plotly)

Preparing Video For Download...