Professional Quantitative Analyst and R programmer
トレーディング指標
TTR:古典的なトレーディング指標のツールボックス
SMA(単純移動平均)
CTAで一般的:200日移動平均
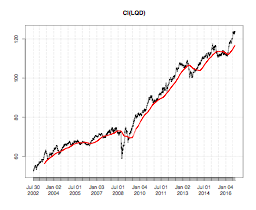
過去10か月の価格推移を示す
SMA() の使用
# Compute a simple moving average (SMA) across 200 days
sma <- SMA(x = Cl(LQD), n = 200)

# Add the SMA line to your plot of LQD closing price
plot(Cl(LQD))
lines(sma, col = "red")