ACSの誤差範囲を可視化する

R による米国国勢調査データの分析

Kyle Walker

Instructor

不確かさの可視化

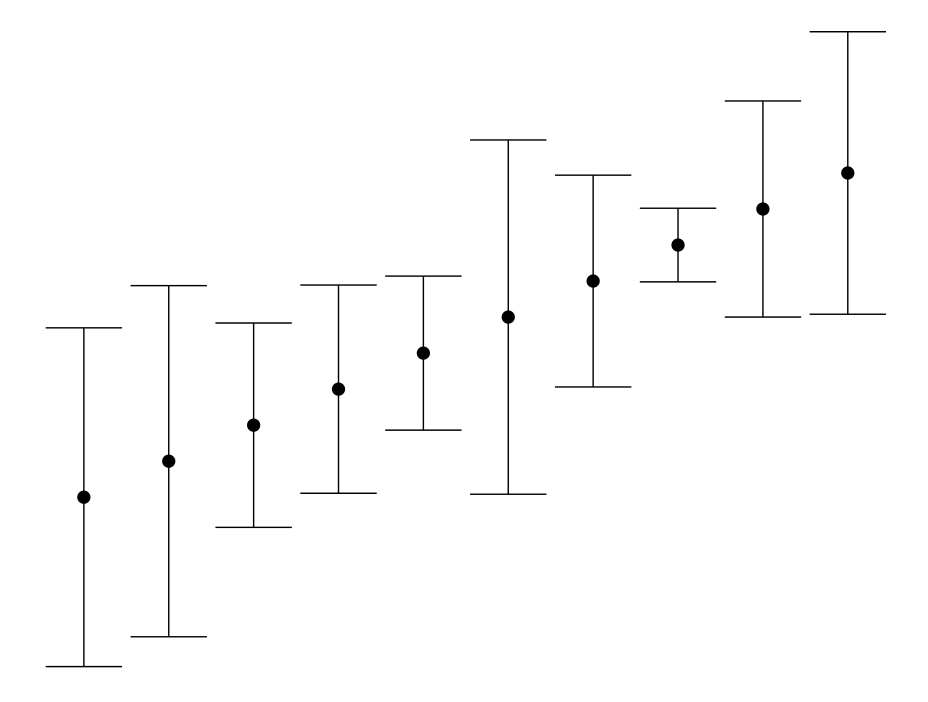
  • よく使われる方法:エラーバープロット

エラーバープロットの例

R による米国国勢調査データの分析

ggplot2での誤差範囲プロット

  • ggplot2では:geom_errorbar() と geom_errorbarh()
library(tidycensus)
library(tidyverse)

wyoming_age <- get_acs(geography = "county", 
                       variables = c(medianage = "B01002_001"), 
                       state = "WY")  

ggplot(wyoming_age, aes(x = estimate, y = NAME)) + 
  geom_errorbarh(aes(xmin = estimate - moe, 
                     xmax = estimate + moe)) + 
  geom_point()
R による米国国勢調査データの分析

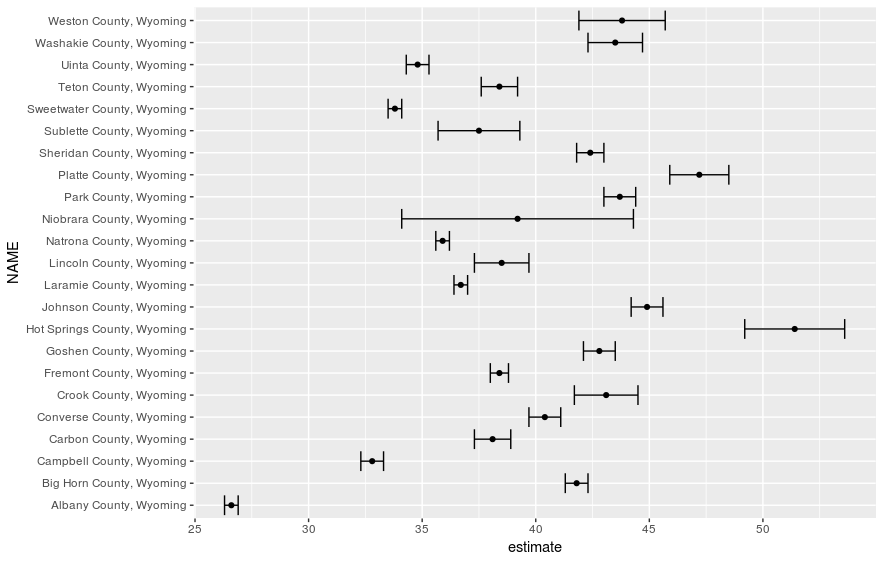
未フォーマットの誤差範囲プロット

R による米国国勢調査データの分析

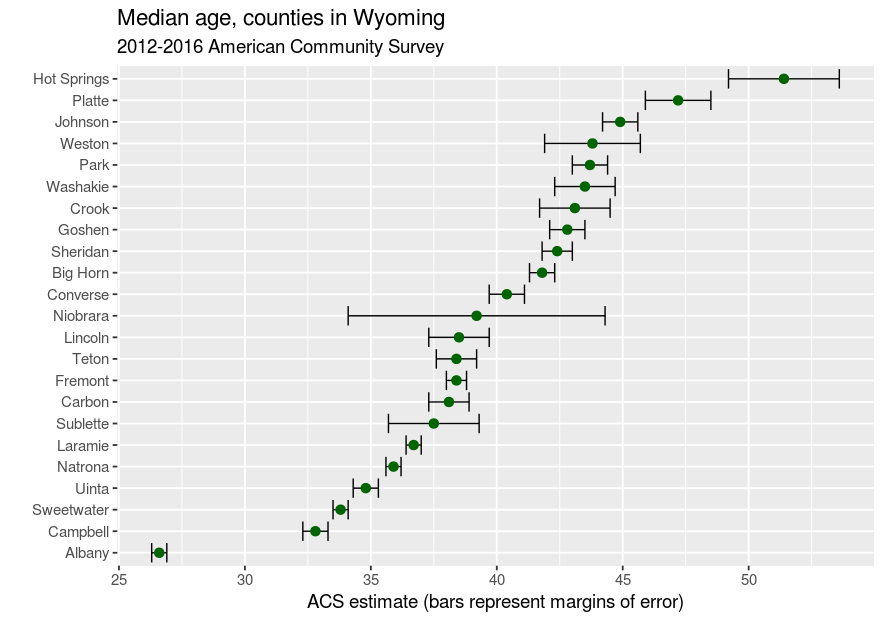
誤差範囲プロットのフォーマット

wyoming_age2 <- wyoming_age %>%
  mutate(NAME = str_replace(NAME, " County, Wyoming", ""))

ggplot(wyoming_age2, aes(x = estimate, y = reorder(NAME, estimate))) + geom_errorbarh(aes(xmin = estimate - moe, xmax = estimate + moe)) + geom_point(size = 3, color = "darkgreen") + theme_grey(base_size = 14) + labs(title = "Median age, counties in Wyoming", subtitle = "2012-2016 American Community Survey", x = "ACS estimate (bars represent margins of error)", y = "")
R による米国国勢調査データの分析

フォーマット済みの誤差範囲プロット

R による米国国勢調査データの分析

練習しましょう!

R による米国国勢調査データの分析

Preparing Video For Download...