R によるカテゴリカルデータの推測
Andrew Bray
Assistant Professor of Statistics at Reed College
男女で信じる割合は異なるか?
$p$ を死後の世界を信じる割合とする。
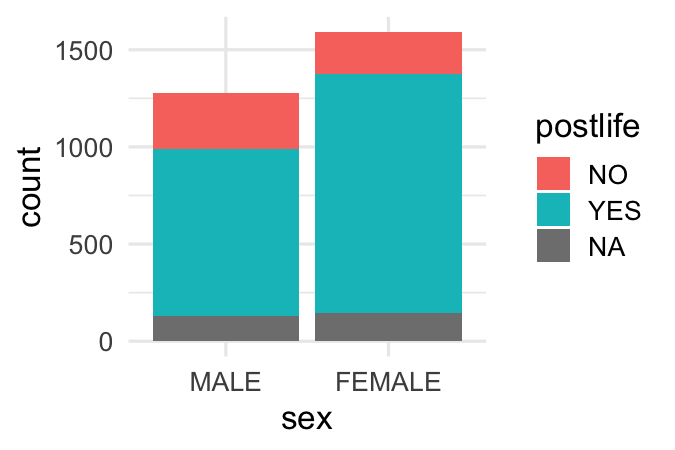
ggplot(gss2016, aes(x = sex, fill = postlife)) +
  geom_bar()
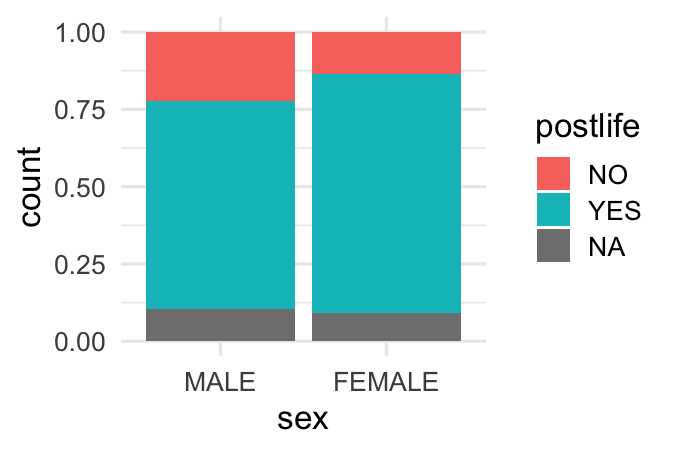
ggplot(gss2016, aes(x = sex, fill = postlife)) +
  geom_bar(position = "fill")
p_hats <- gss2016 %>%
  group_by(sex) %>%
  summarize(mean(postlife == "YES", na.rm = TRUE)) %>%
  pull()
d_hat <- diff(p_hats)
d_hat
0.1472851
postlife
sex
⇒ 置換でデータを生成
gss2016 %>%
  specify(
    response = postlife,
    explanatory = sex,
    success = "YES"
  ) %>%
  hypothesize(null = "independence") %>%
  generate(reps = 1, type = "permute")
gss2016 %>%
  specify(
    postlife ~ sex,  # この行が新規
    success = "YES"
  ) %>%
  hypothesize(null = "independence") %>%
  generate(reps = 1, type = "permute")
Response: postlife (factor)
Explanatory: sex (factor)
Null Hypothesis:  independence
# A tibble: 137 x 3
# Groups:   replicate [1]
   postlife sex    replicate
   <fct>    <fct>      <int>
 1 YES      FEMALE         1
 2 YES      MALE           1
 3 YES      FEMALE         1
 4 YES      MALE           1
 5 YES      MALE           1
 6 YES      FEMALE         1
 7 NO       FEMALE         1
gss2016 %>%
  specify(
    postlife ~ sex,
    success = "YES"
  ) %>%
  hypothesize(null = "independence") %>%
  generate(reps = 1, type = "permute")
Response: postlife (factor)
Explanatory: sex (factor)
Null Hypothesis:  independence
# A tibble: 137 x 3
# Groups:   replicate [1]
   postlife sex    replicate
   <fct>    <fct>      <int>
 1 YES      FEMALE         1
 2 NO       MALE           1
 3 NO       FEMALE         1
 4 YES      MALE           1
 5 YES      MALE           1
 6 YES      FEMALE         1
 7 YES      FEMALE         1
gss2016 %>%
  specify(postlife ~ sex, success = "YES") %>%
  hypothesize(null = "independence") %>%
  generate(reps = 500, type = "permute") %>%
  calculate(stat = "diff in props", order = c("FEMALE", "MALE"))
Warning message:
Removed 13 rows containing missing values.
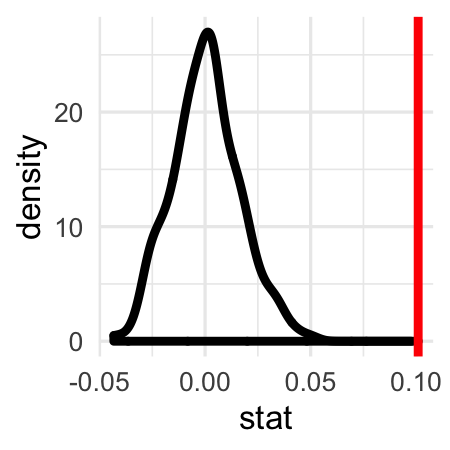
ggplot(null, aes(x = stat)) +
  geom_density() +
  geom_vline(xintercept = d_hat, color = "red")
このデータは、死後の世界を巡る信念に性差があることを示唆します。