R によるカテゴリカルデータの推測
Andrew Bray
Assistant Professor of Statistics at Reed College
null <- data %>%
  specify(var1 ~ var2) %>%
  hypothesize(null = "independence") %>%
  generate(reps = 100, type = "permute") %>%
  calculate(stat = ?)
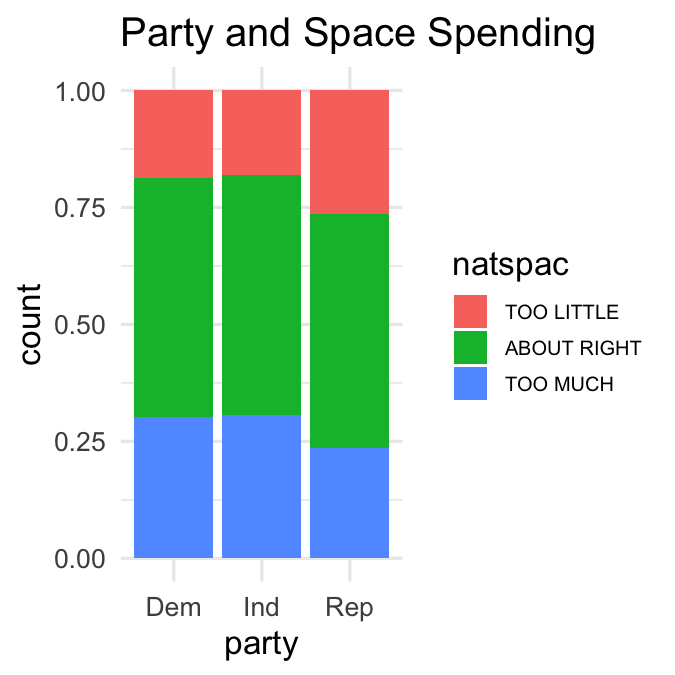
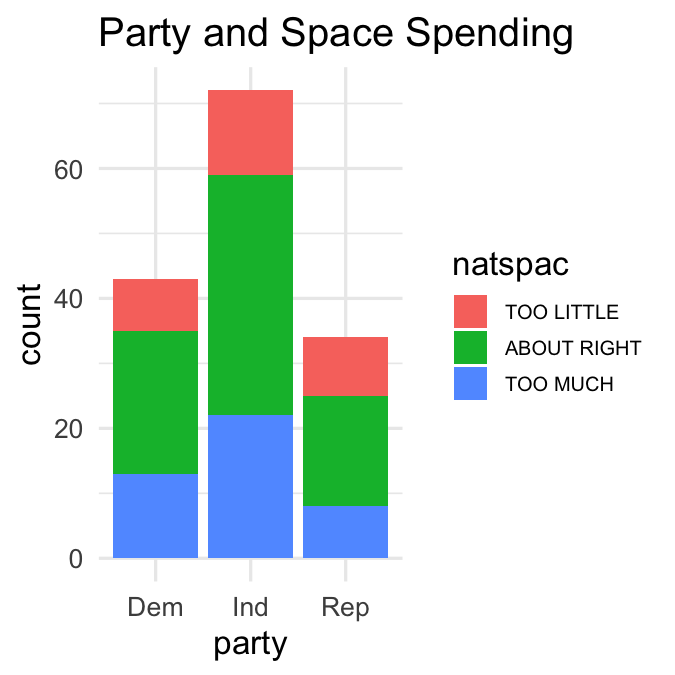
observed_counts
             party
natspac       Dem Ind Rep
  TOO LITTLE    8  13   9
  ABOUT RIGHT  22  37  17
  TOO MUCH     13  22   8
expected_counts
             party
natspac        Dem  Ind  Rep
  TOO LITTLE   8.7 14.5  6.8
  ABOUT RIGHT 21.9 36.7 17.3
  TOO MUCH    12.4 20.8  9.8
(observed_counts - expected_counts) ^ 2
             party
natspac         Dem   Ind   Rep
  TOO LITTLE  0.433 2.240 4.641
  ABOUT RIGHT 0.005 0.076 0.117
  TOO MUCH    0.349 1.492 3.284
sum((observed_counts - expected_counts) ^ 2)
12.63565