Rで学ぶマーケットバスケット分析
Christopher Bruffaerts
Statistician
アイテム頻度プロット
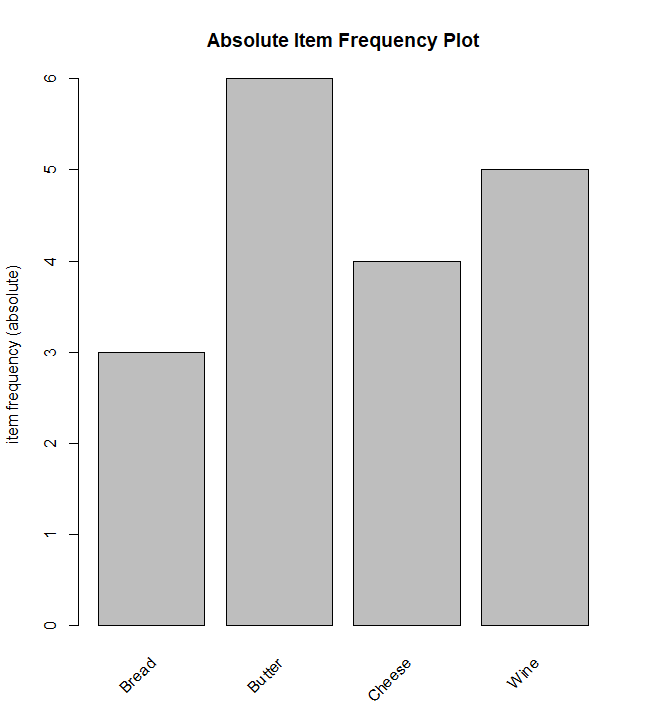
絶対値タイプ
itemFrequencyPlot(data_trx,
                  main='Absolute Item Frequency Plot',
                  type="absolute"
)
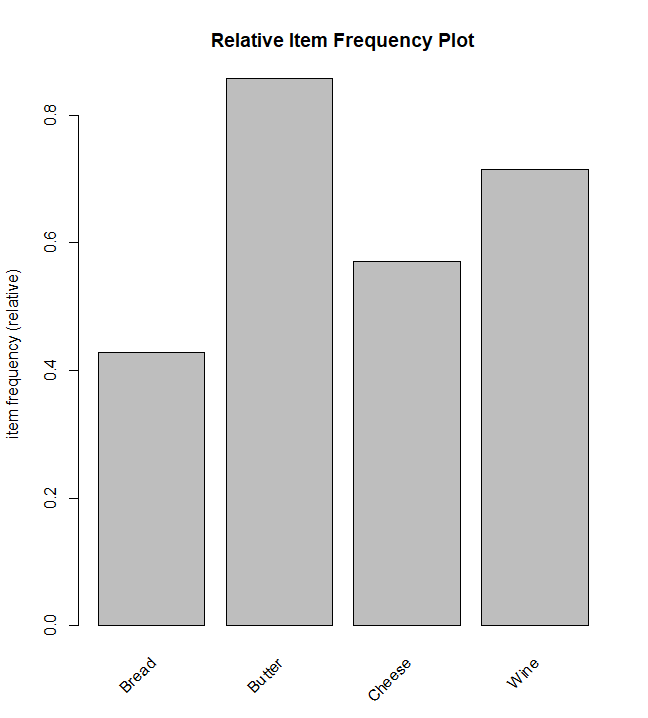
相対値タイプ
itemFrequencyPlot(data_trx,
                  main='Relative Item Frequency Plot',
                  type="relative"
)
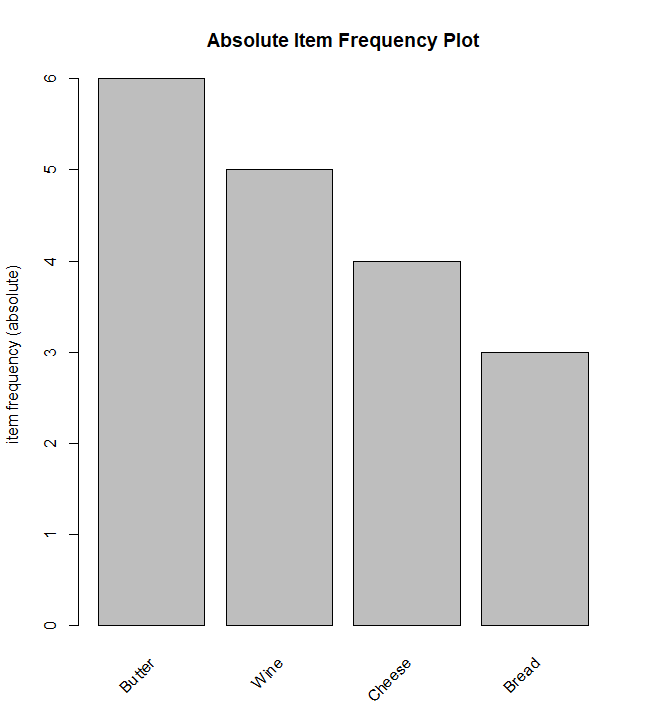
topNで並べ替えとフィルタ
itemFrequencyPlot(
  data_trx,
  topN = 4,
  main = 'Absolute Item Frequency Plot',
  type = "absolute"
)
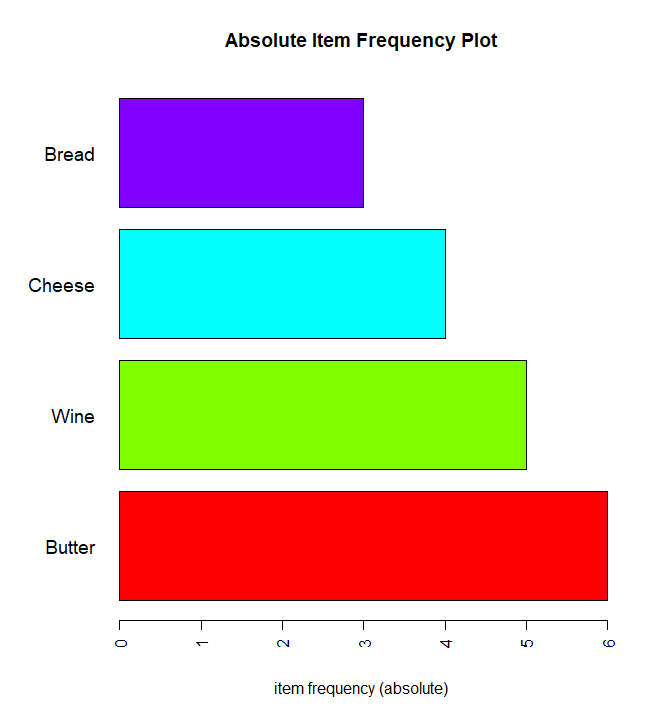
プロットの反転とカスタマイズ
itemFrequencyPlot(
  data_trx,
  topN = 4,
  main = 'Absolute Item Frequency Plot',
  type = "absolute",
  col = rainbow(4),
  ylab = "",
  cex.names = 1.2,
  horiz = TRUE
)