差次的結合の概要
Rで学ぶBioconductorによるChIP-seq

Peter Humburg
Statistician, Macquarie University
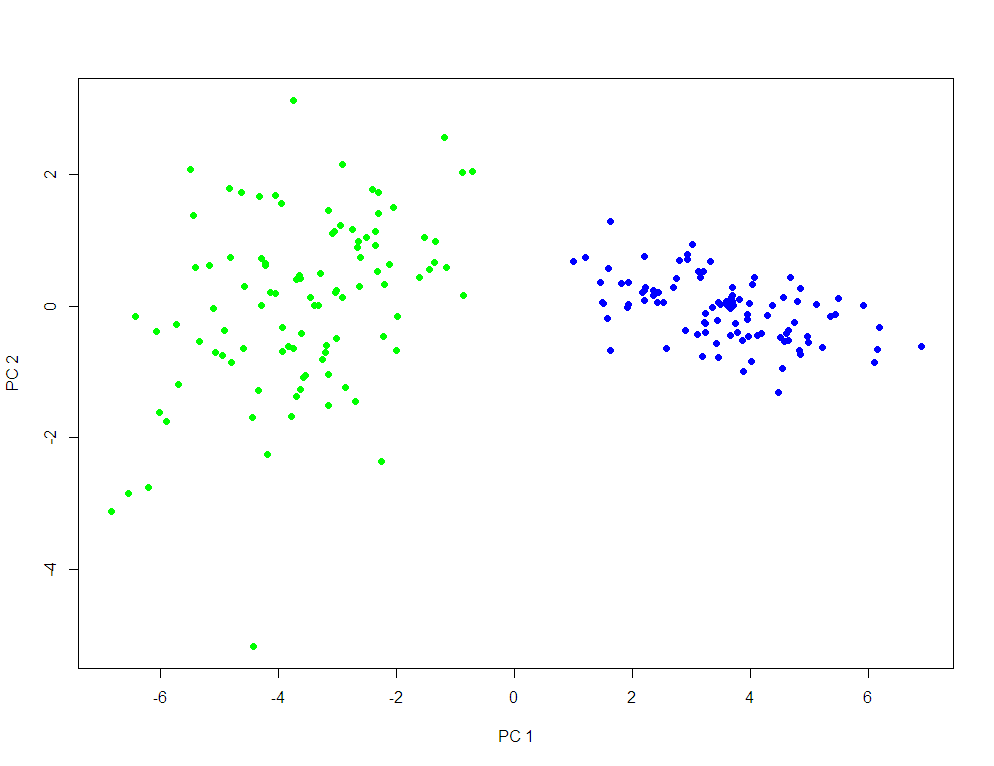
ヒートマップ
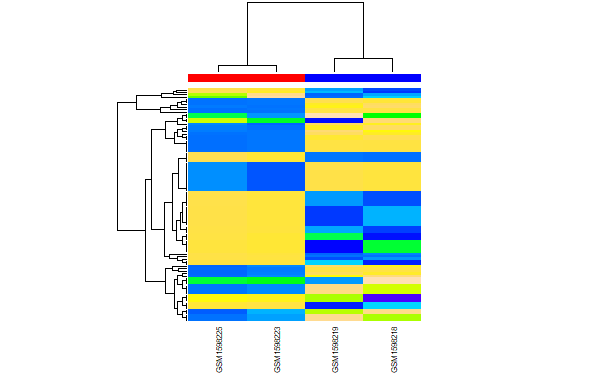
ピークのカバレッジデータからヒートマップを作成する
dba.plotHeatmap(peaks, maxSites = peak_count, correlations = FALSE)
Rで学ぶBioconductorによるChIP-seq
Peter Humburg
Statistician, Macquarie University
ピークのカバレッジデータからヒートマップを作成する
dba.plotHeatmap(peaks, maxSites = peak_count, correlations = FALSE)

