Bokeh 入門

Bokehで学ぶインタラクティブ・データビジュアライゼーション

George Boorman

Core Curriculum Manager, DataCamp
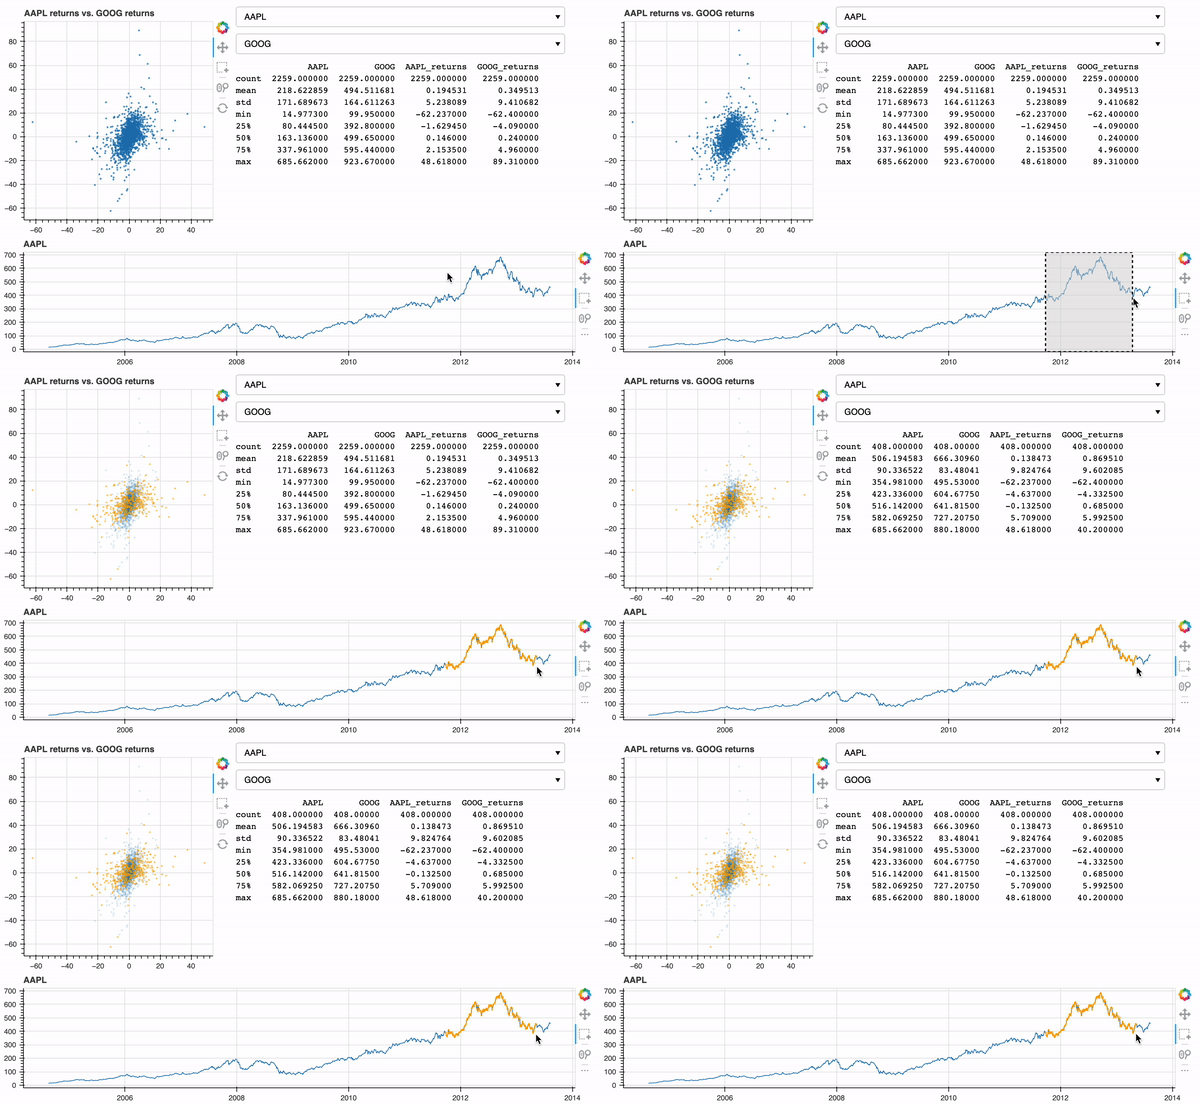
Bokeh とは?

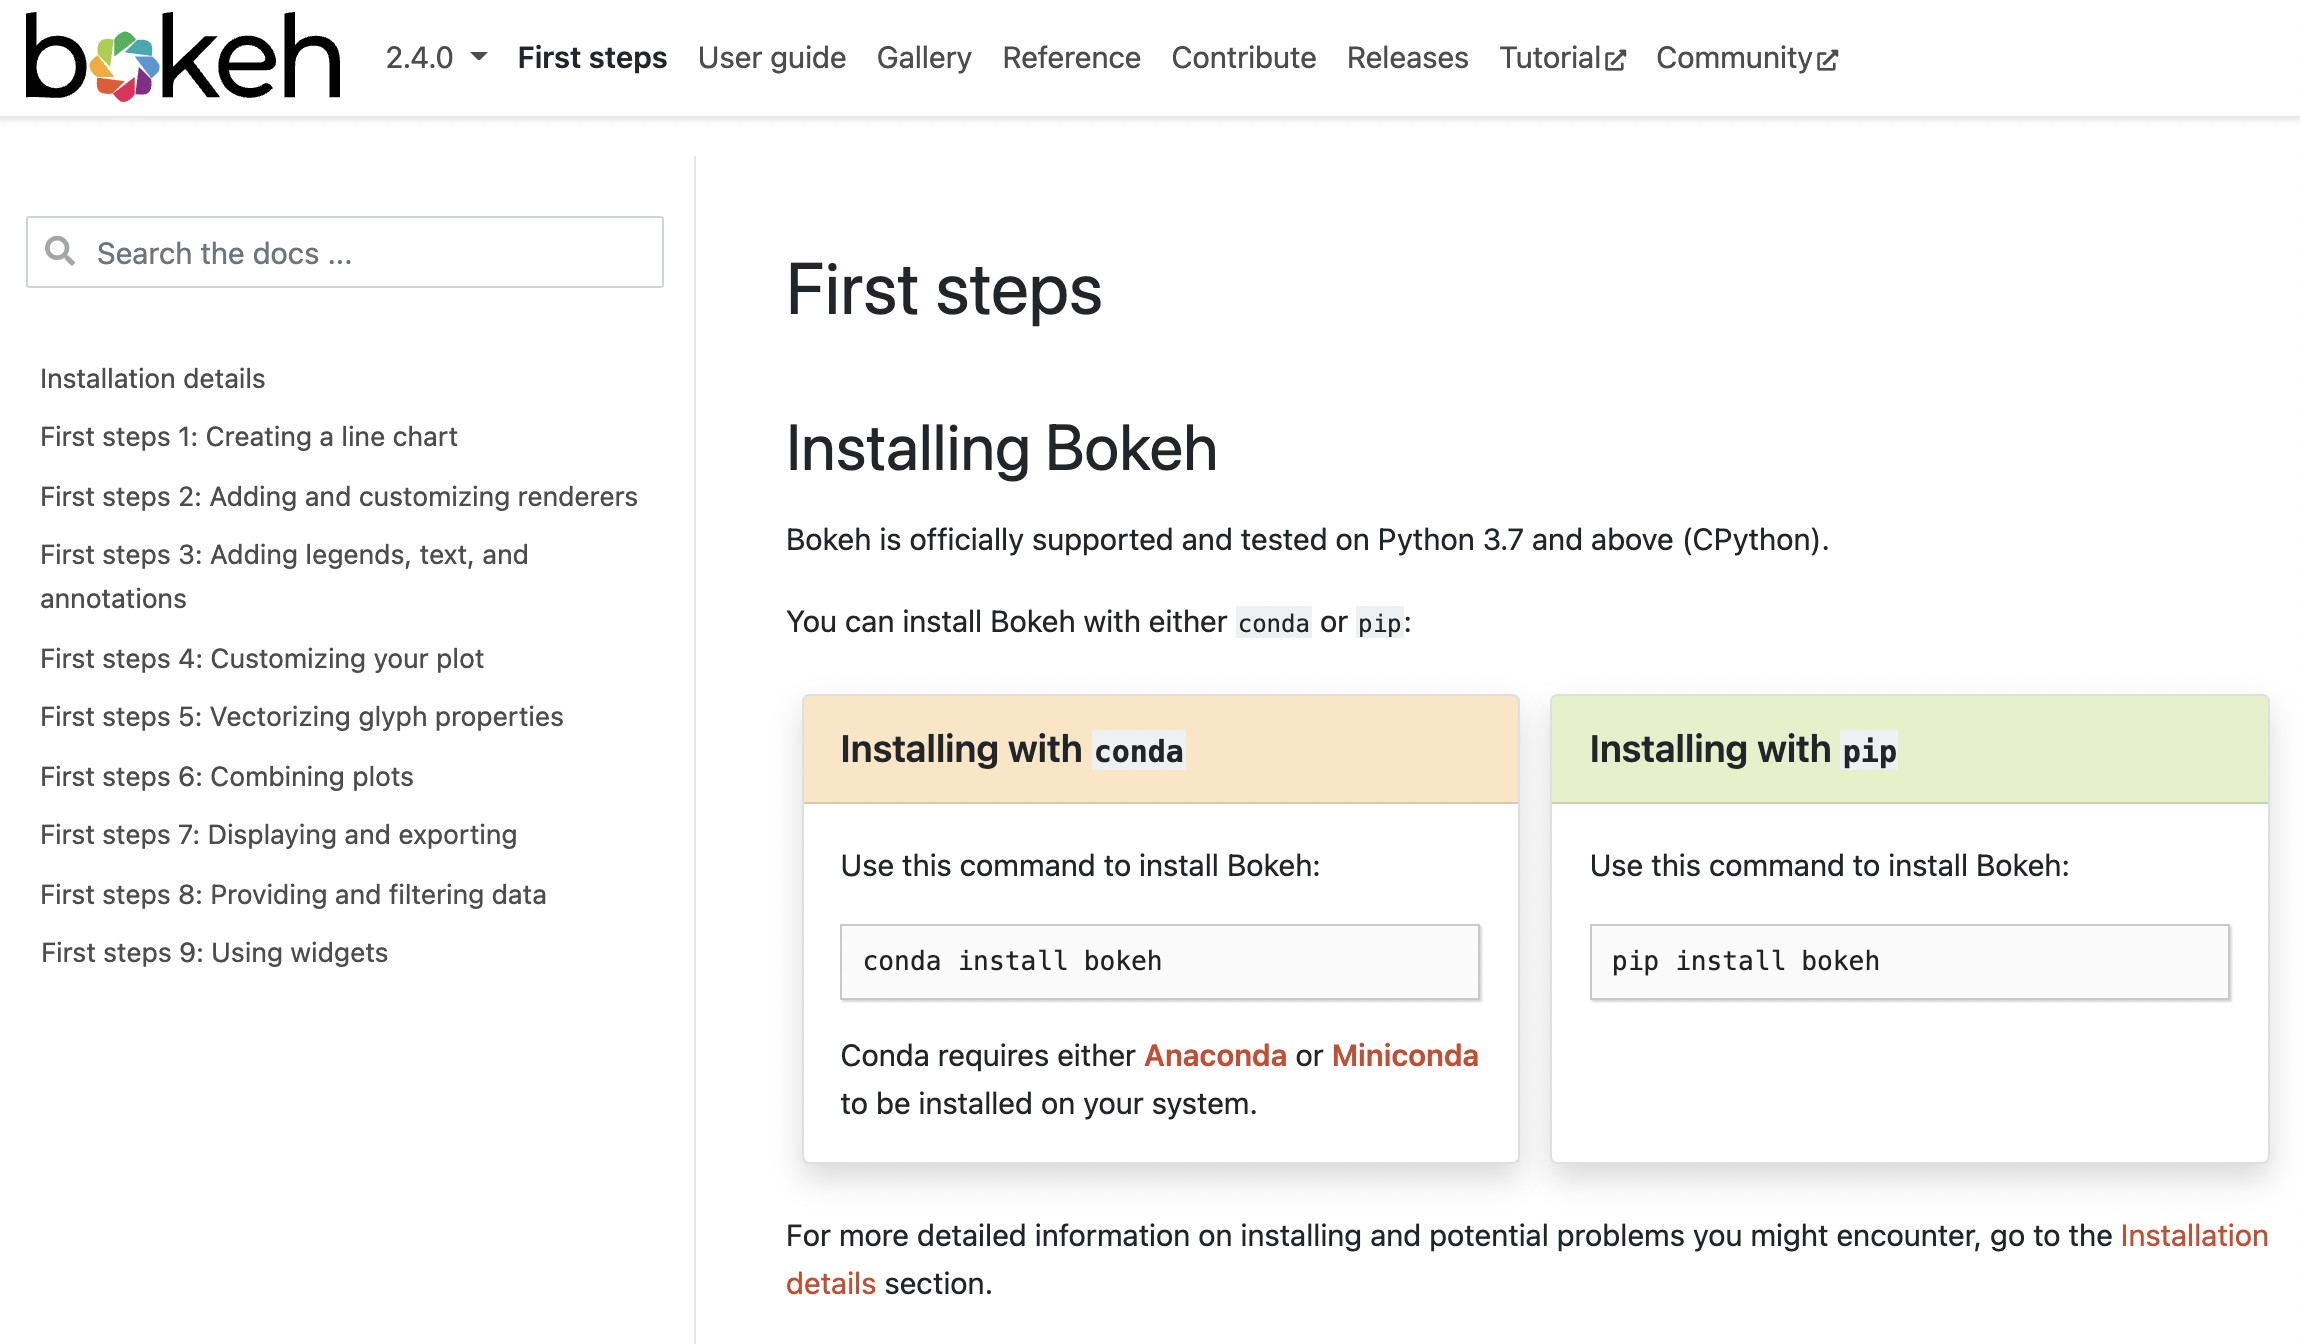
ドキュメント画面

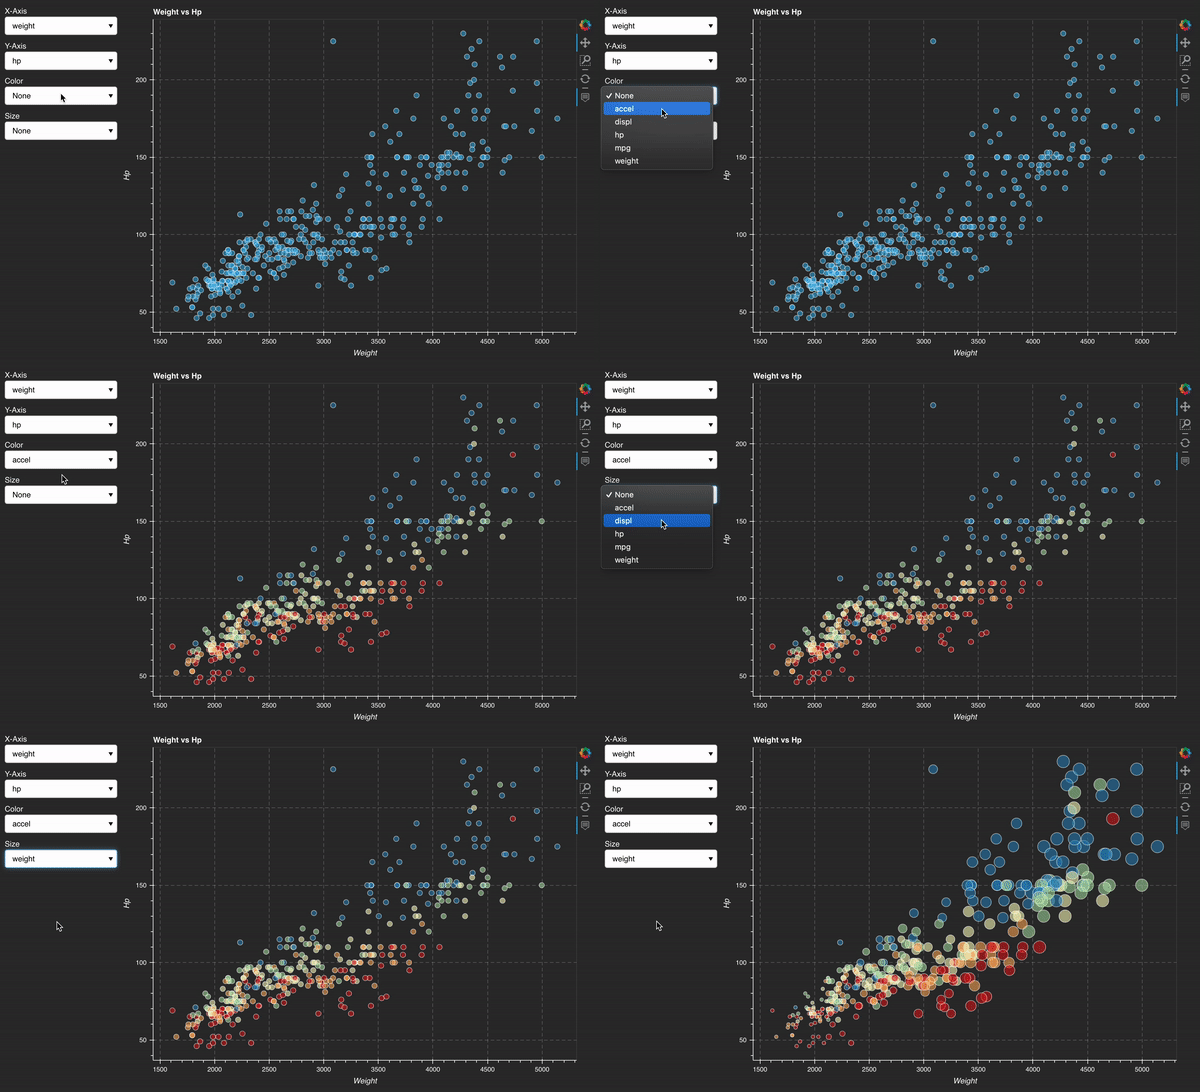
車のインタラクティブ可視化

Bokehで学ぶインタラクティブ・データビジュアライゼーション

コース概要

  • 第1章: Bokeh 入門
  • 第2章: 可視化のカスタマイズ
  • 第3章: 可視化で伝える
  • 第4章: ウィジェット入門
Bokehで学ぶインタラクティブ・データビジュアライゼーション
import pandas as pd
nba = pd.read_csv("nba.csv")
print(nba.columns)
Index(['player', 'position', 'minutes', 'field_goal_perc', 'three_point_perc',
       'free_throw_perc', 'rebounds', 'assists', 'steals', 'blocks', 'points',
       'team', 'conference', 'scorer_category'],
      dtype='object')
print(nba.shape)
(424, 14)
Bokehで学ぶインタラクティブ・データビジュアライゼーション

Figure を準備する

from bokeh.plotting import figure

from bokeh.io import output_file, show
fig = figure()
output_file(filename="empty_figure.html")
show(fig)

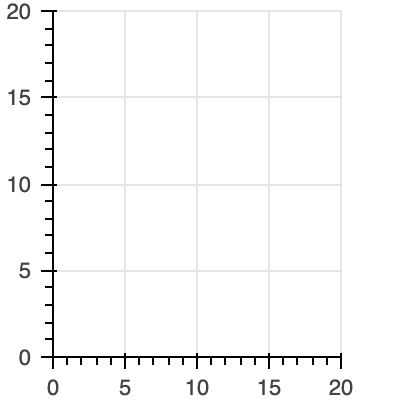
空の図

Bokehで学ぶインタラクティブ・データビジュアライゼーション

散布図を作る

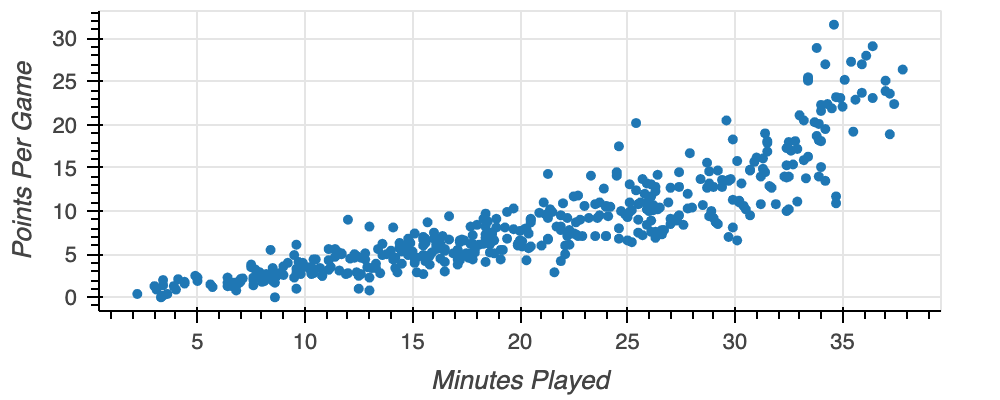
fig = figure(x_axis_label="Minutes Played", y_axis_label="Points Per Game")

fig.circle(x=nba["minutes"], y=nba["points"])
output_file(filename="nba_points.html") show(fig)

nba 散布図

Bokehで学ぶインタラクティブ・データビジュアライゼーション

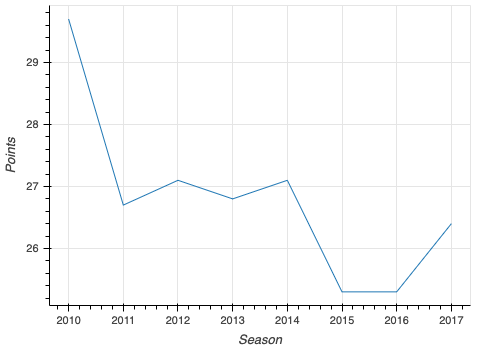
折れ線グラフを表示

fig = figure(x_axis_label="Season", y_axis_label="Points")

fig.line(x=lebron["season"], y=lebron["points"])
output_file(filename="lebron_points_per_season.html") show(fig)

レブロン 折れ線グラフ

Bokehで学ぶインタラクティブ・データビジュアライゼーション

カテゴリーデータを描く

positions = nba.groupby("position", as_index=False)["points"].mean()

fig = figure(x_axis_label="Position", y_axis_label="Points per Game",
x_range=positions["position"])
fig.vbar(x=positions["position"], top=positions["points"])
output_file(filename="nba_points_by_position.html") show(fig)
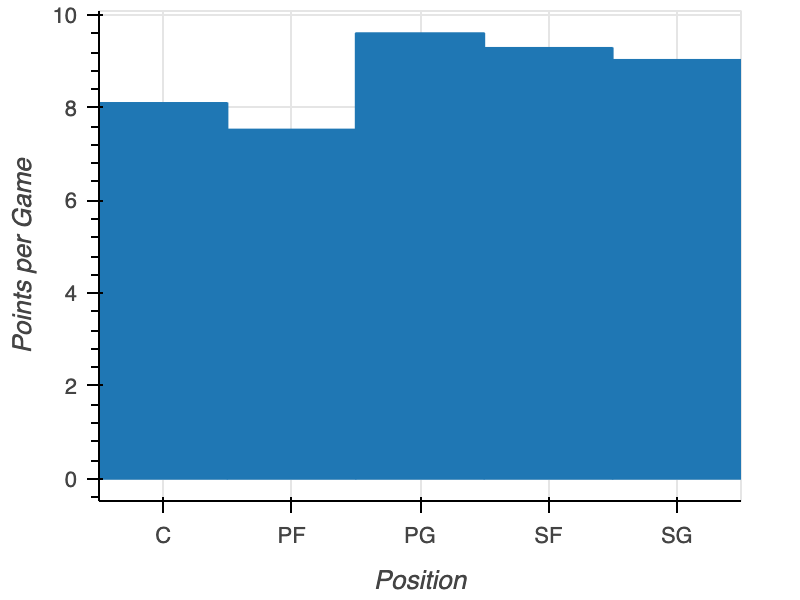
NBA ポジション別

Bokehで学ぶインタラクティブ・データビジュアライゼーション

Let's practice!

Bokehで学ぶインタラクティブ・データビジュアライゼーション

Preparing Video For Download...