はじめに・動機
Rで学ぶ不正検知

Bart Baesens
Professor Data Science at KU Leuven
講師紹介
講師紹介

講師紹介
詐欺とは何か?
詐欺とは、まれに発生し、周到に計画され、巧みに隠蔽された、時間とともに変化する、しばしば組織的な犯罪であり、多様な形態をとる。

優れた不正検知モデルの主な特性

優れた不正検知モデルの主な特性

優れた不正検知モデルの主な特性

優れた不正検知モデルの主な特性

優れた不正検知モデルの主な特性

不正検知モデルの課題

不正検知モデルの課題

不正検知モデルの課題

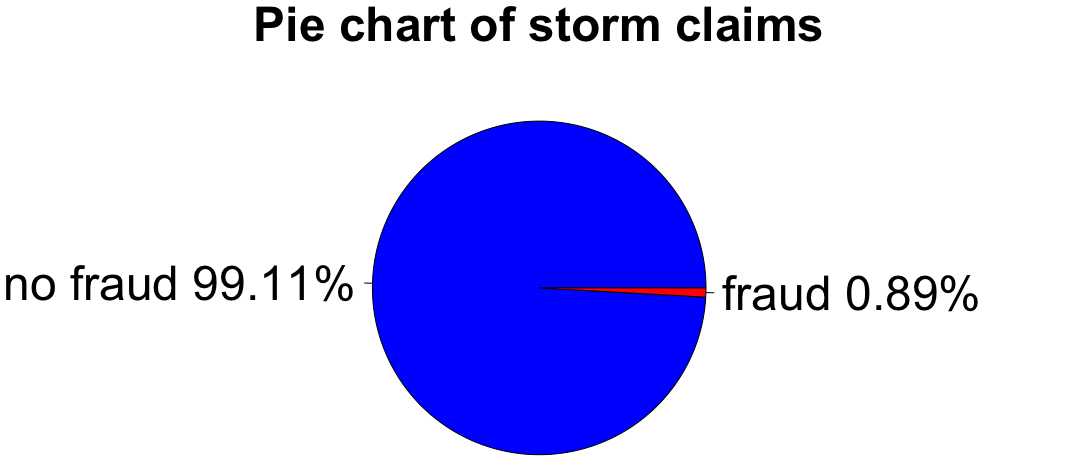
円グラフで不均衡を可視化
labels <- c("no fraud", "fraud")
labels <- paste(labels, round(100 * prop.table(table(fraud_label)), 2), "%")
pie(table(fraud_label), labels, col = c("blue", "red"),
      main = "Pie chart of storm claims")
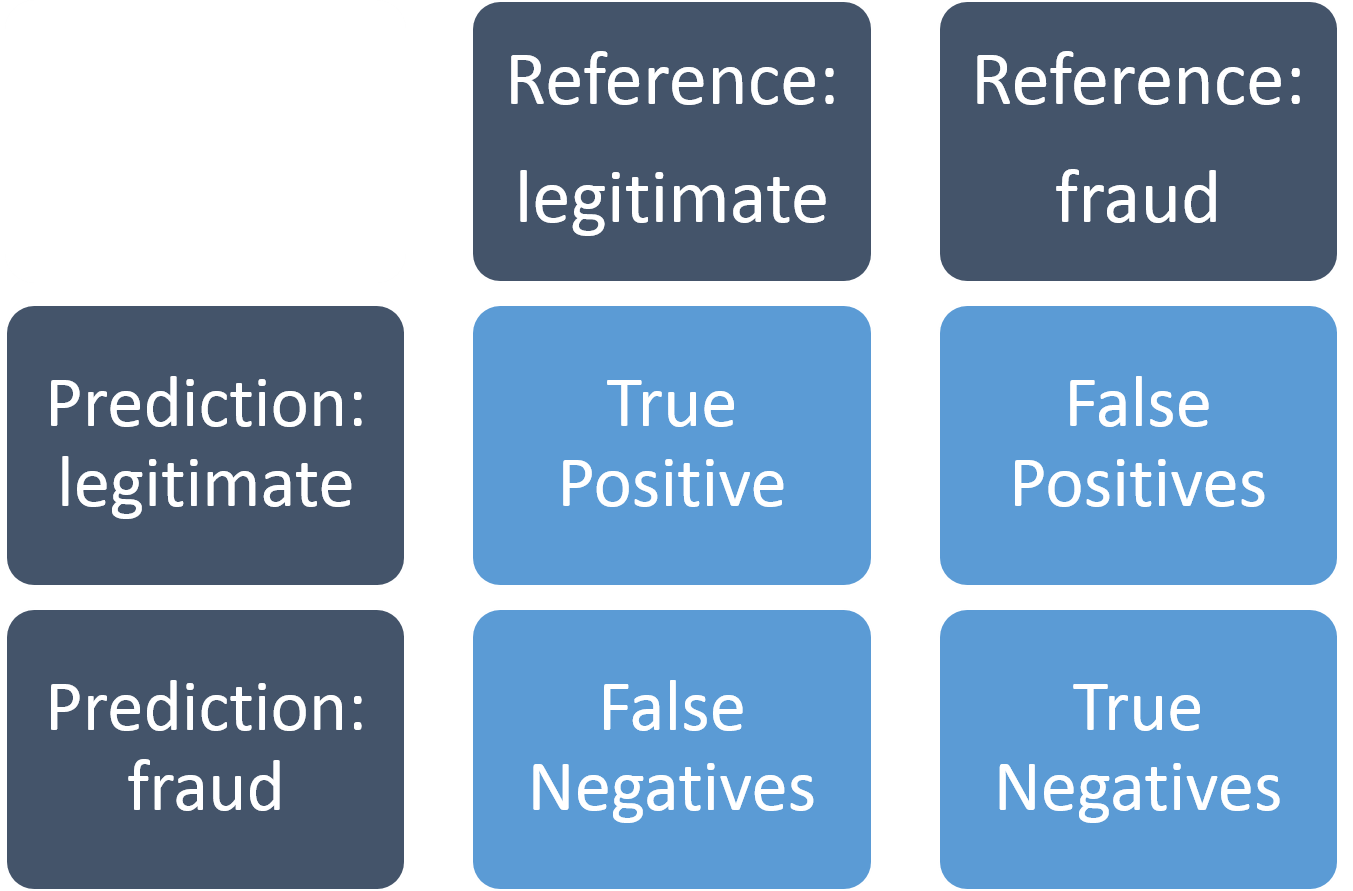
混同行列
不正検知モデルの評価に使用: