Tidyverseを使った結果の可視化

Rで学ぶスケーラブルなデータ処理

Michael Kane

Assistant Professor, Yale University

年別の欠損状況

library(ggplot2)
library(tidyr)
library(dplyr)


mort %>% bigtable(c("borrower_gender", "year")) %>% as.data.frame()
Rで学ぶスケーラブルなデータ処理

年別の欠損状況

library(ggplot2)
library(tidyr)
library(dplyr)

mort %>% 
  bigtable(c("borrower_gender", "year")) %>% 
  as.data.frame() %>% 
  mutate(Category = c("Male", "Female", "Not Provided", 
                      "Not Applicable", "Missing"))
Rで学ぶスケーラブルなデータ処理

年別の欠損状況

library(ggplot2)
library(tidyr)
library(dplyr)

mort %>% 
  bigtable(c("borrower_gender", "year")) %>% 
  as.data.frame() %>% 
  mutate(Category = c("Male", "Female", "Not Provided", 
                      "Not Applicable", "Missing")) %>%
  pivot_longer(-Category, names_to = "Year", values_to = "Count") %>%
  arrange(Year)
Rで学ぶスケーラブルなデータ処理

年別の欠損状況

library(ggplot2)
library(tidyr)
library(dplyr)

mort %>% 
  bigtable(c("borrower_gender", "year")) %>% 
  as.data.frame() %>% 
  mutate(Category = c("Male", "Female", "Not Provided", 
                      "Not Applicable", "Missing")) %>%
  pivot_longer(-Category, names_to = "Year", values_to = "Count") %>%
  arrange(Year) %>%
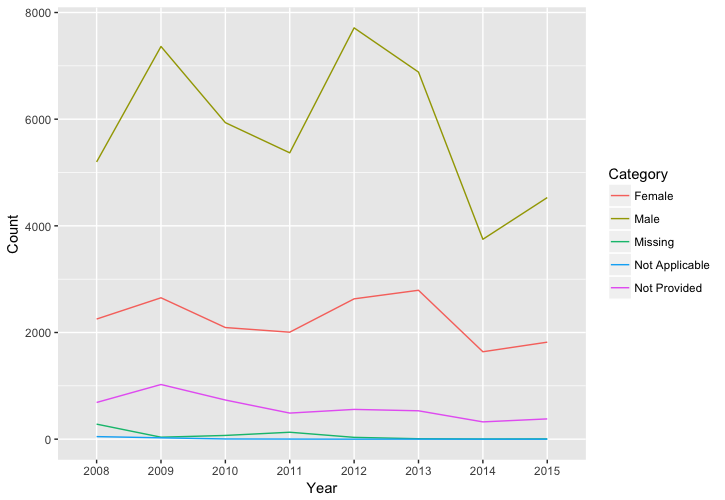
  ggplot(aes(x = Year, y = Count, group = Category, 
                color = Category)) + 
  geom_line()
Rで学ぶスケーラブルなデータ処理

Rで学ぶスケーラブルなデータ処理

練習しましょう!

Rで学ぶスケーラブルなデータ処理

Preparing Video For Download...