グラブス検定による極値のテスト
Rで学ぶ異常検知入門

Alastair Rushworth
Data Scientist
視覚的な評価は常に信頼できるとは限りません!
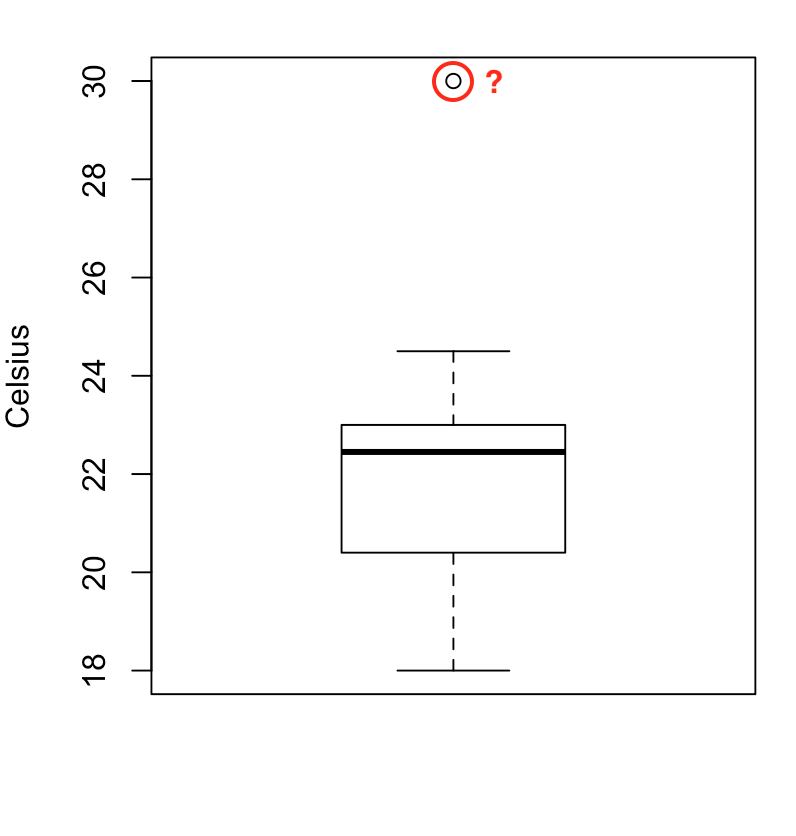
boxplot(temperature, ylab = "Celsius")
ヒストグラムで正規性を確認する
hist(temperature, breaks = 6)
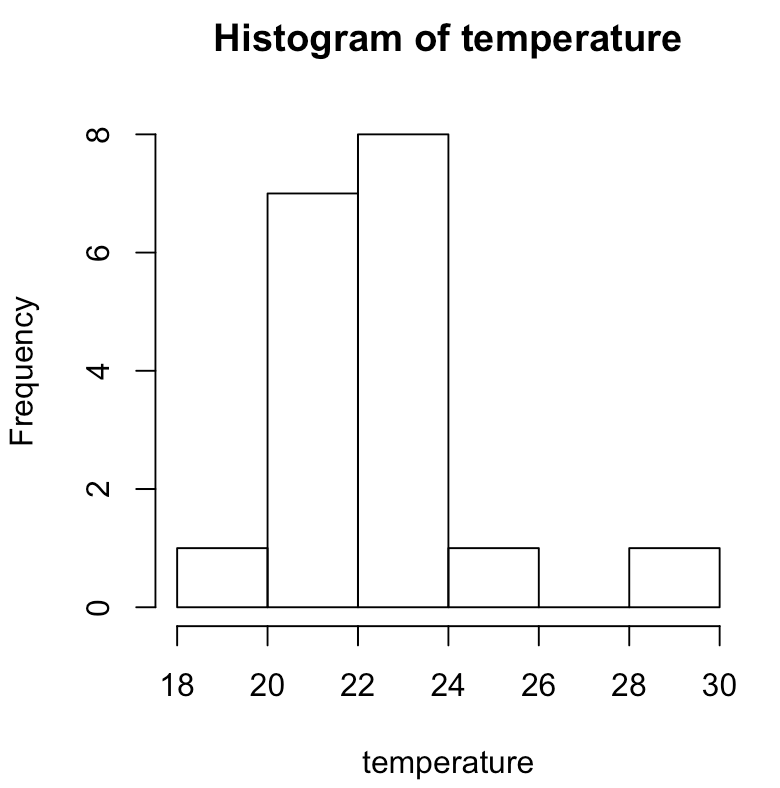
左右対称でベル型ですか?
Rで学ぶ異常検知入門
Alastair Rushworth
Data Scientist
boxplot(temperature, ylab = "Celsius")
hist(temperature, breaks = 6)
左右対称でベル型ですか?

