季節性のある時系列で複数の外れ値を検出する

Rで学ぶ異常検知入門

Alastair Rushworth

Data Scientist

月次売上データ

head(msales)
  sales month
1 6.068     1
2 5.966     2
3 6.133     3
4 6.230     4
5 6.407     5
6 6.433     6

Grubbs 検定は不適切

  • 季節性の可能性
  • 複数の外れ値の可能性
Rで学ぶ異常検知入門

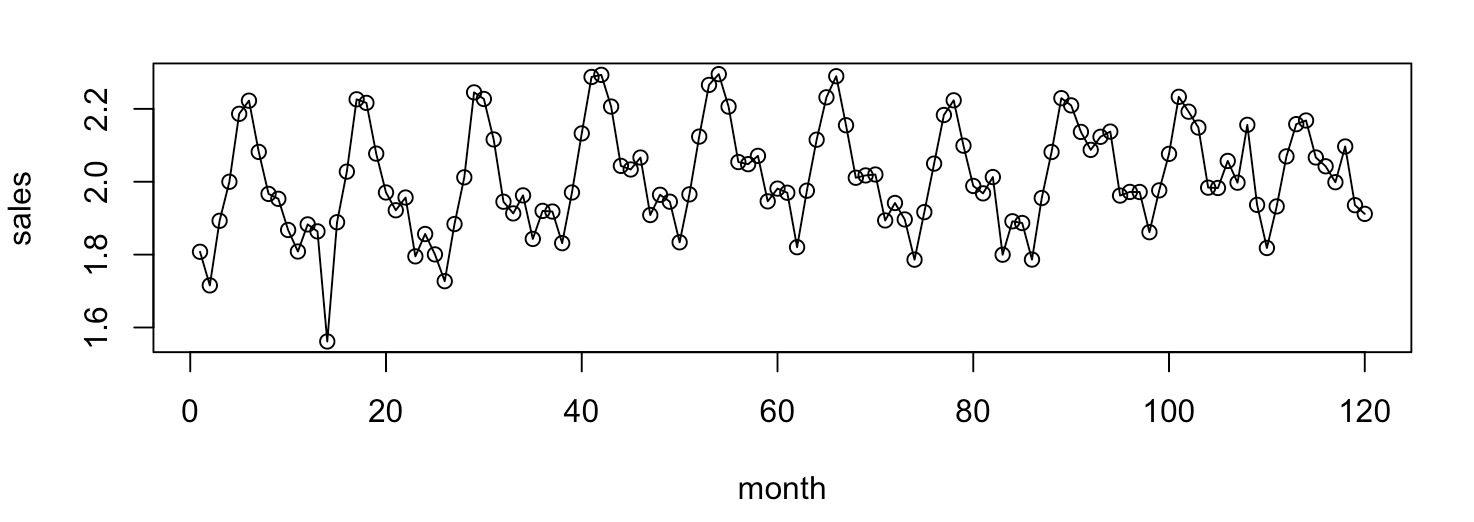
月次売上の可視化

plot(sales ~ month, data = msales, type = 'o')
Rで学ぶ異常検知入門

Seasonal-Hybrid ESD アルゴリズムの使い方

library(AnomalyDetection)
sales_ad <- AnomalyDetectionVec(x = msales$sales, period = 12, 
                                direction = 'both')

引数

  • x: 値のベクトル
  • period: 繰り返し周期
  • direction: 小さい外れ値('neg')、大きい外れ値('pos')、両方('both')を検出

パッケージは https://github.com/twitter/AnomalyDetection から入手

Rで学ぶ異常検知入門

Seasonal-Hybrid ESD アルゴリズムの出力

sales_ad <- AnomalyDetectionVec(x = msales$sales, period = 12, 
                                direction = 'both')
sales_ad$anoms
  index anoms
1    14 1.561
2   108 2.156
Rで学ぶ異常検知入門

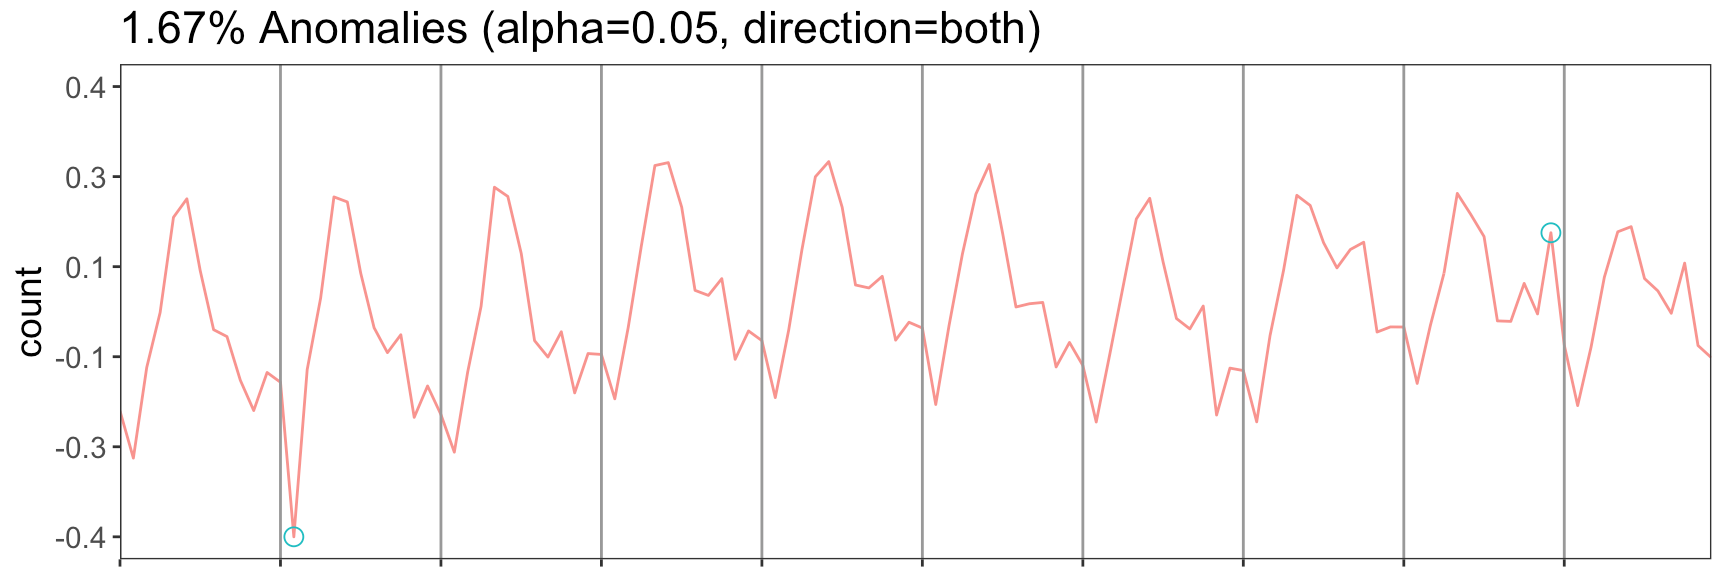
Seasonal-Hybrid ESD アルゴリズムのプロット

AnomalyDetectionVec(x = msales$sales, period = 12, 
                    direction = 'both', plot = T)
Rで学ぶ異常検知入門

演習に進みましょう

Rで学ぶ異常検知入門

Preparing Video For Download...