Giới thiệu về Hồi quy với statsmodels trong Python
Maarten Van den Broeck
Content Developer at DataCamp
| n_claims | total_payment_sek |
|---|---|
| 108 | 392.5 |
| 19 | 46.2 |
| 13 | 15.7 |
| 124 | 422.2 |
| 40 | 119.4 |
| ... | ... |
import pandas as pd
print(swedish_motor_insurance.mean())
n_claims 22.904762
total_payment_sek 98.187302
dtype: float64
print(swedish_motor_insurance['n_claims'].corr(swedish_motor_insurance['total_payment_sek']))
0.9128782350234068
| n_claims | total_payment_sek |
|---|---|
| 108 | 3925 |
| 19 | 462 |
| 13 | 157 |
| 124 | 4222 |
| 40 | 1194 |
| 200 | ??? |
Biến bạn muốn dự đoán.
Các biến giải thích cách biến phản hồi thay đổi.
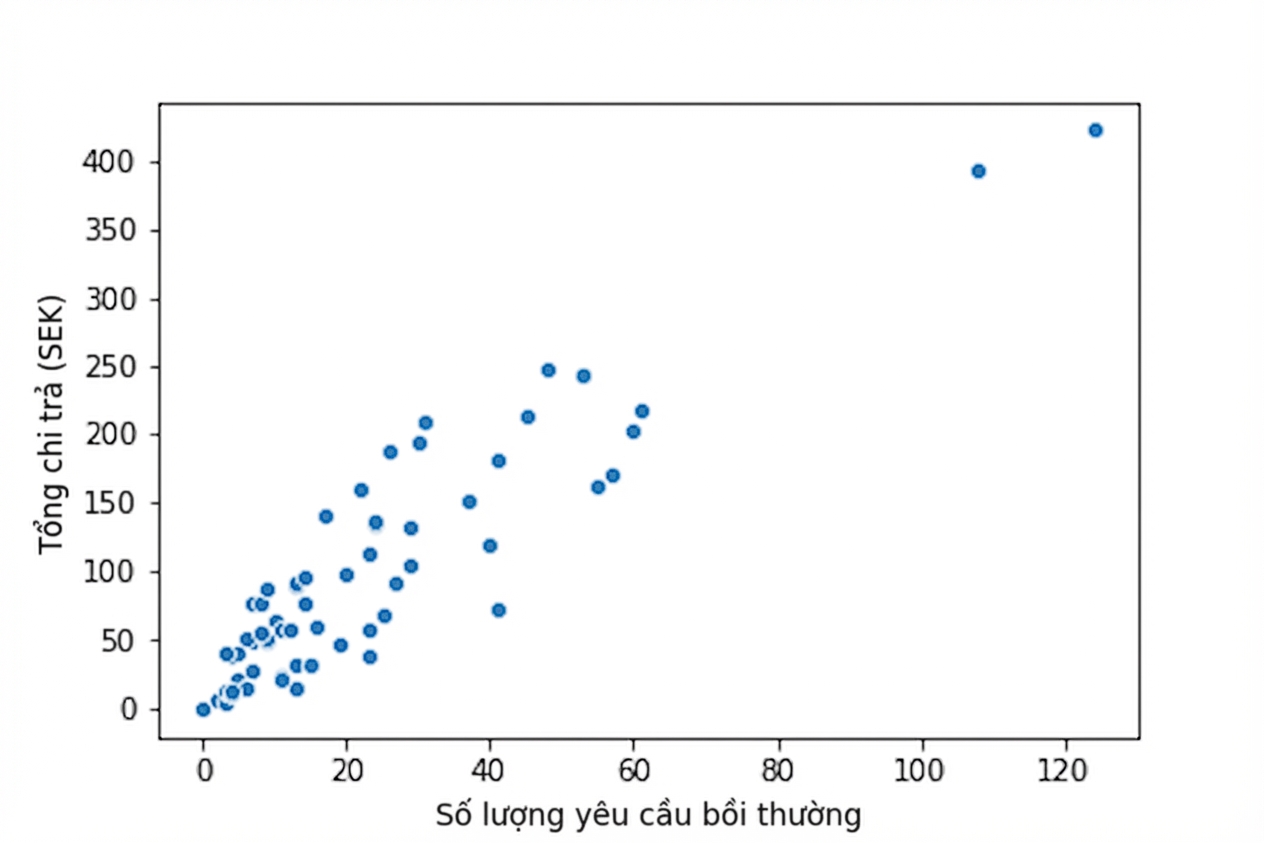
import matplotlib.pyplot as plt
import seaborn as sns
sns.scatterplot(x="n_claims",
y="total_payment_sek",
data=swedish_motor_insurance)
plt.show()

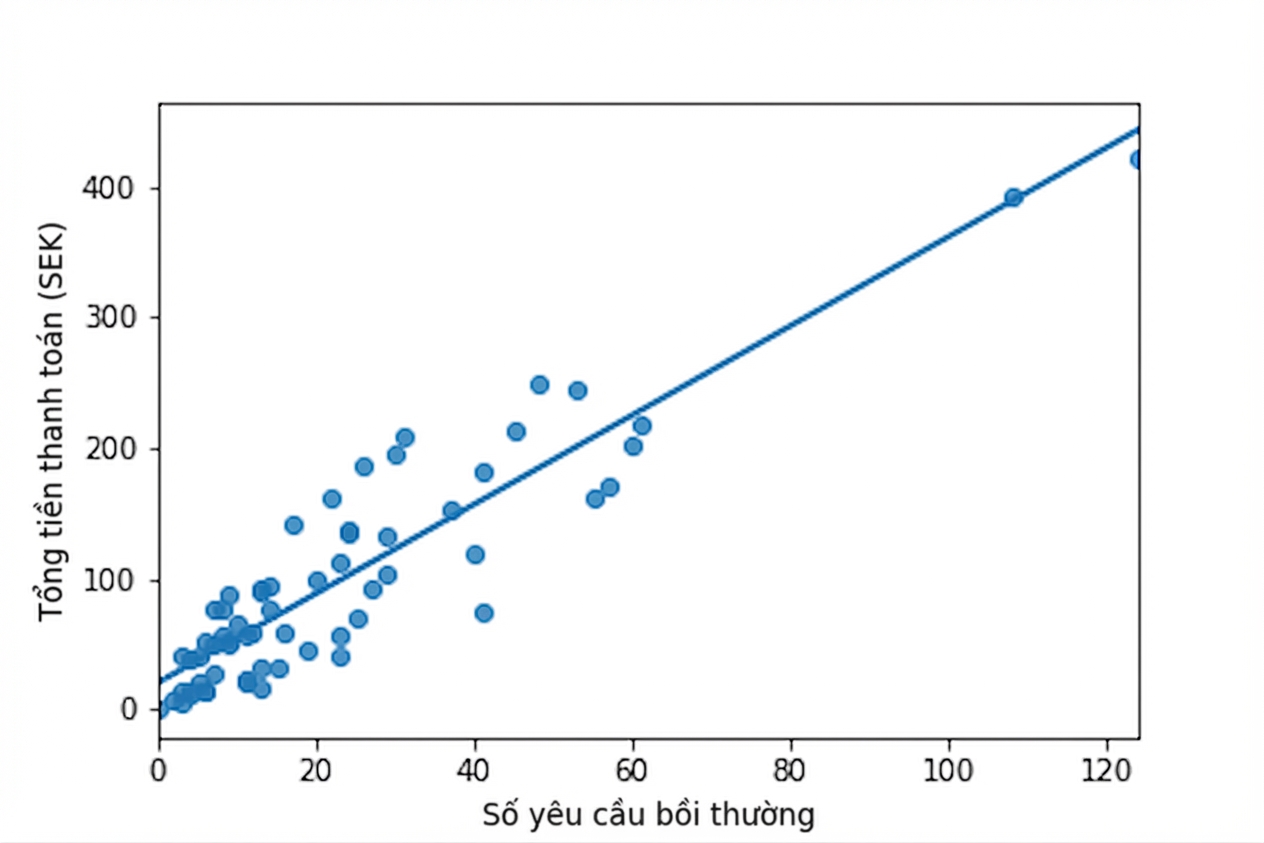
sns.regplot(x="n_claims",
y="total_payment_sek",
data=swedish_motor_insurance,
ci=None)

Trực quan hóa và khớp mô hình hồi quy tuyến tính.
Dự đoán từ mô hình tuyến tính và hiểu hệ số mô hình.
Đánh giá chất lượng mô hình tuyến tính.
Lặp lại với mô hình hồi quy logistic.
statsmodelsscikit-learnGiới thiệu về Hồi quy với statsmodels trong Python