Visualizing trends

Nhập môn Python cho Tài chính

Adina Howe

Professor

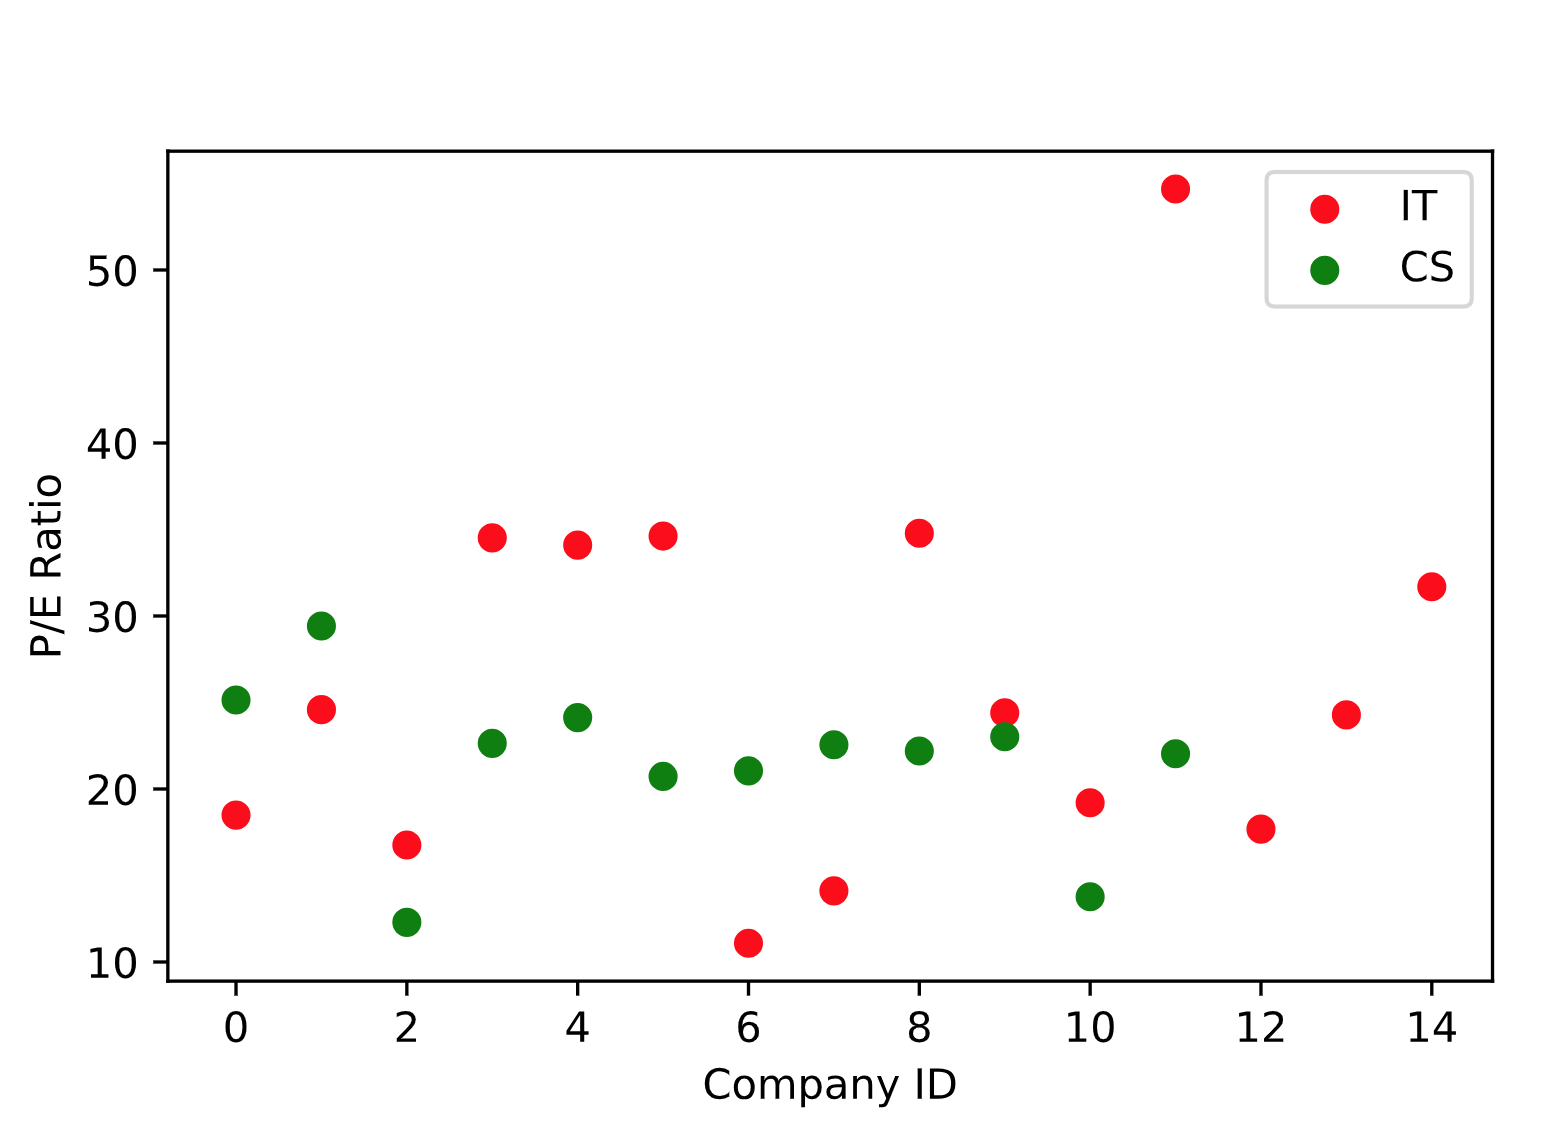
Your mission - outlier?

peratio

Nhập môn Python cho Tài chính

Step 1: Make a histogram

import matplotlib.pyplot as plt
plt.hist(hist_data, bins = 8)
plt.show()
Nhập môn Python cho Tài chính

Step 2: Identify the Outlier

  • Identify the outlier P/E ratio
  • Create a boolean array filter to subset this company
  • Filter out this company information from the provided datasets
Nhập môn Python cho Tài chính

Let's practice!

Nhập môn Python cho Tài chính

Preparing Video For Download...