Visualization in Python

Nhập môn Python cho Tài chính

Adina Howe

Professor

Matplotlib: A visualization package

See more of the Matplotlib gallery by clicking this link.

matplotlib

Nhập môn Python cho Tài chính

matplotlib.pyplot - diverse plotting functions

import matplotlib.pyplot as plt
Nhập môn Python cho Tài chính

matplotlib.pyplot - diverse plotting functions

  • plt.plot()

    • takes arguments that describe the data to be plotted
  • plt.show()

    • displays plot to screen
Nhập môn Python cho Tài chính

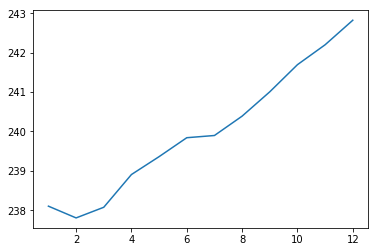
Plotting with pyplot

import matplotlib.pyplot as plt
plt.plot(months, prices)
plt.show()
Nhập môn Python cho Tài chính

Plot result

Simple plot2

Nhập môn Python cho Tài chính

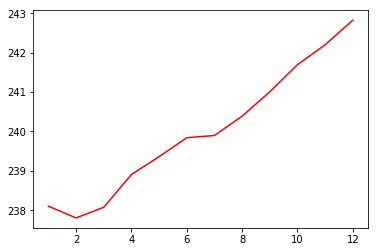
Red solid line

import matplotlib.pyplot as plt
plt.plot(months, prices, color = 'red')
plt.show()
Nhập môn Python cho Tài chính

Plot result

redline

Nhập môn Python cho Tài chính

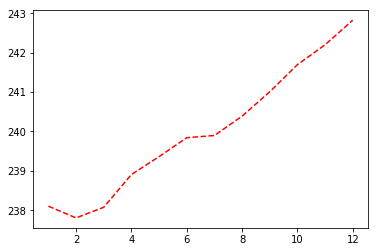
Dashed line

import matplotlib.pyplot as plt
plt.plot(months, prices, color = 'red', linestyle = '--')
plt.show()
Nhập môn Python cho Tài chính

Plot result

dash

Nhập môn Python cho Tài chính

Colors and linestyles

color
'green' green
'red' red
'cyan' cyan
'blue' blue
linestyle
'-' solid line
'--' dashed line
'-.' dashed dot line
':' dotted

More documentation on colors and lines can be found here.

Nhập môn Python cho Tài chính

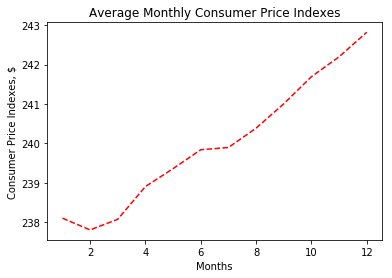
Adding Labels and Titles

import matplotlib.pyplot as plt
plt.plot(months, prices, color = 'red', linestyle = '--')

# Add labels
plt.xlabel('Months')
plt.ylabel('Consumer Price Indexes, $')
plt.title('Average Monthly Consumer Price Indexes')

# Show plot
plt.show()
Nhập môn Python cho Tài chính

Plot result

labeled_plot

Nhập môn Python cho Tài chính

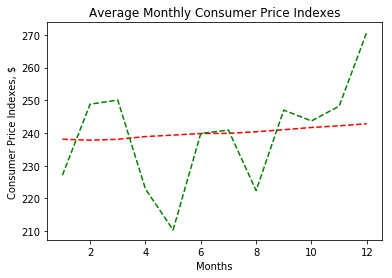
Adding additional lines

import matplotlib.pyplot as plt
plt.plot(months, prices, color = 'red', linestyle = '--')

# adding an additional line
plt.plot(months, prices_new, color = 'green', linestyle = '--') 

plt.xlabel('Months')
plt.ylabel('Consumer Price Indexes, $')
plt.title('Average Monthly Consumer Price Indexes')
plt.show()
Nhập môn Python cho Tài chính

Plot result

twolines

Nhập môn Python cho Tài chính

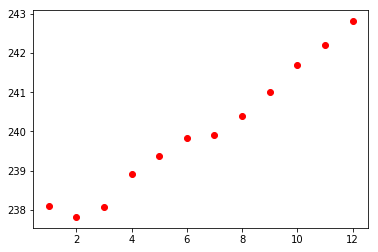
Scatterplots

import matplotlib.pyplot as plt
plt.scatter(x = months, y = prices, color = 'red')
plt.show()
Nhập môn Python cho Tài chính

Scatterplot result

scatterplot

Nhập môn Python cho Tài chính

Let's practice!

Nhập môn Python cho Tài chính

Preparing Video For Download...