Predictions and odds ratios

Nhập môn Hồi quy bằng R

Richie Cotton

Data Evangelist at DataCamp

The ggplot predictions
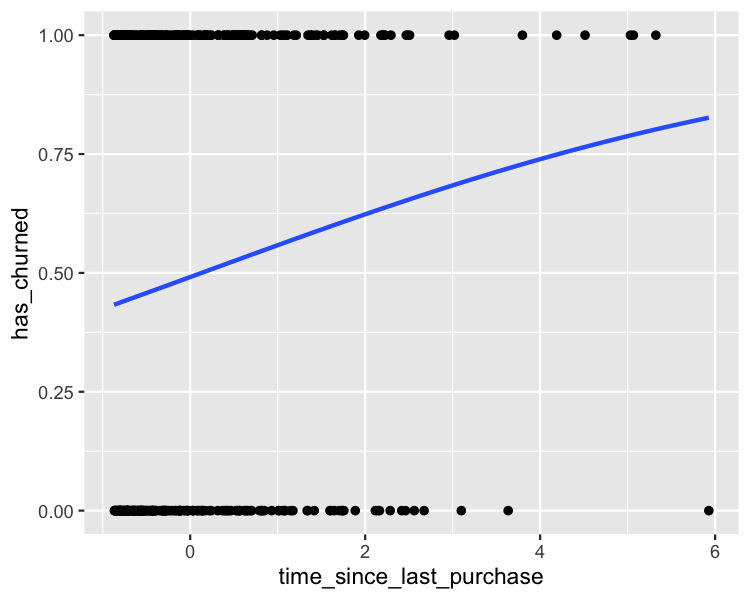
plt_churn_vs_recency_base <- ggplot(
  churn, 
  aes(time_since_last_purchase, has_churned)
) +
  geom_point() +
  geom_smooth(
    method = "glm", 
    se = FALSE, 
    method.args = list(family = binomial)
  )

A scatter plot of churn versus time since last purchase, with a logistic trend line.

Nhập môn Hồi quy bằng R

Making predictions

mdl_recency <- glm(
  has_churned ~ time_since_last_purchase, data = churn, family = "binomial"
)
explanatory_data <- tibble(
  time_since_last_purchase = seq(-1, 6, 0.25)
)
prediction_data <- explanatory_data %>% 
  mutate(
    has_churned = predict(mdl_recency, explanatory_data, type = "response")
  )
Nhập môn Hồi quy bằng R

Adding point predictions

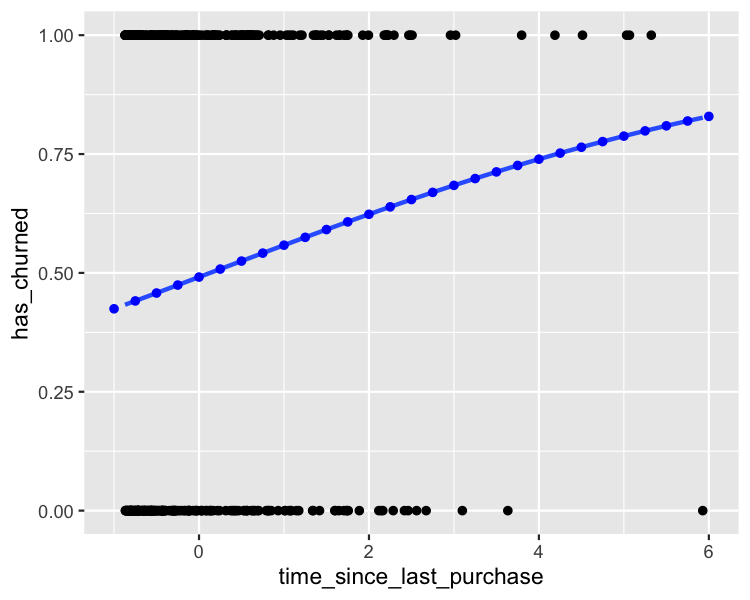
plt_churn_vs_recency_base +
  geom_point(
    data = prediction_data, 
    color = "blue"
  )

The scatter plot of churn versus time since last purchase, with a logistic trend line. The plot is annotated with the results from predict(), which follow the trend line exactly.

Nhập môn Hồi quy bằng R

Getting the most likely outcome

prediction_data <- explanatory_data %>% 
  mutate(
    has_churned = predict(mdl_recency, explanatory_data, type = "response"),
    most_likely_outcome = round(has_churned)
  )
Nhập môn Hồi quy bằng R

Visualizing most likely outcome

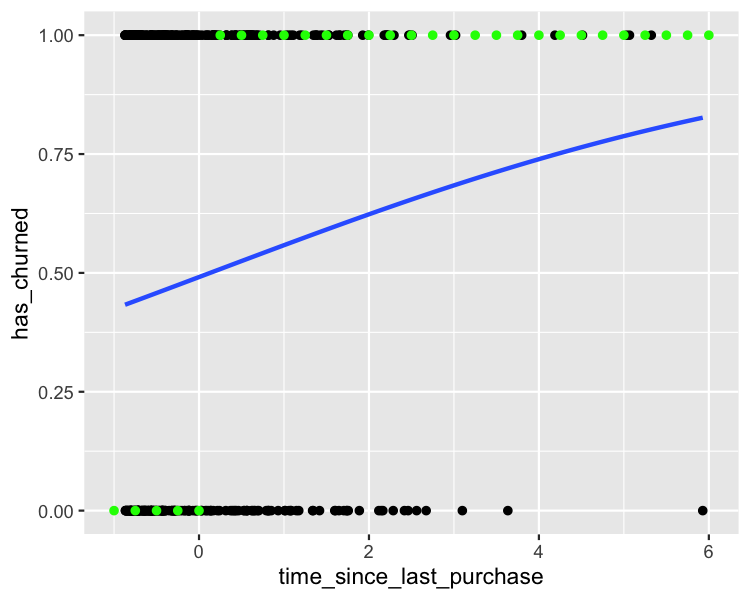
plt_churn_vs_recency_base +
  geom_point(
    aes(y = most_likely_outcome),
    data = prediction_data,
    color = "green"
  )

The scatter plot of churn versus time since last purchase, with a logistic trend line. The plot is annotated with the most likely outcomes. For low time since last purchase, the most likely outcome is not churning. For high time since last purchase, the most likely outcome is churning.

Nhập môn Hồi quy bằng R

Odds ratios

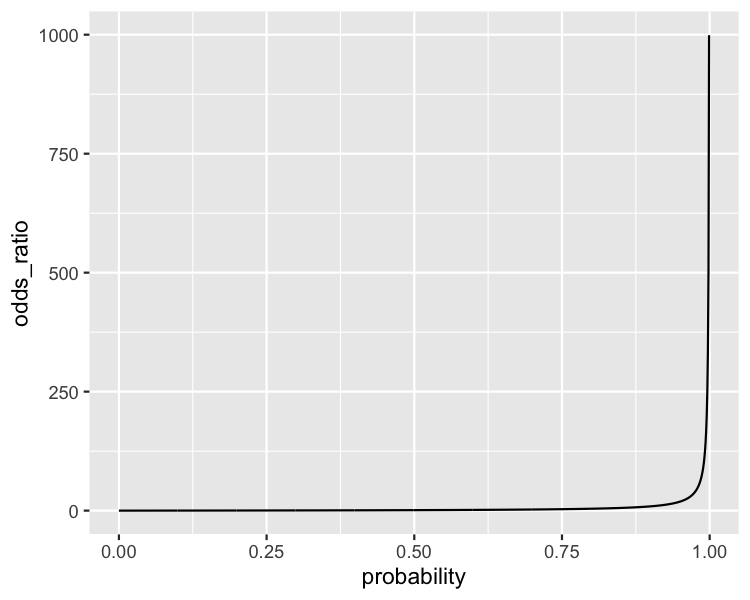
Odds ratio is the probability of something happening divided by the probability that it doesn't.

$$ odds\_ratio = \frac{probability}{(1 - probability)} $$

$$ odds\_ratio = \frac{0.25}{(1 - 0.25)} = \frac{1}{3} $$

A line plot of odds ratio versus probability. The curve increases asymptotically to infinity as probability tends towards one.

Nhập môn Hồi quy bằng R

Calculating odds ratio

prediction_data <- explanatory_data %>%
  mutate(
    has_churned = predict(mdl_recency, explanatory_data, type = "response"),
    most_likely_response = round(has_churned),
    odds_ratio = has_churned / (1 - has_churned)
  )
Nhập môn Hồi quy bằng R

Visualizing odds ratio

ggplot(
  prediction_data, 
  aes(time_since_last_purchase, odds_ratio)
) +
  geom_line() +
  geom_hline(yintercept = 1, linetype = "dotted")

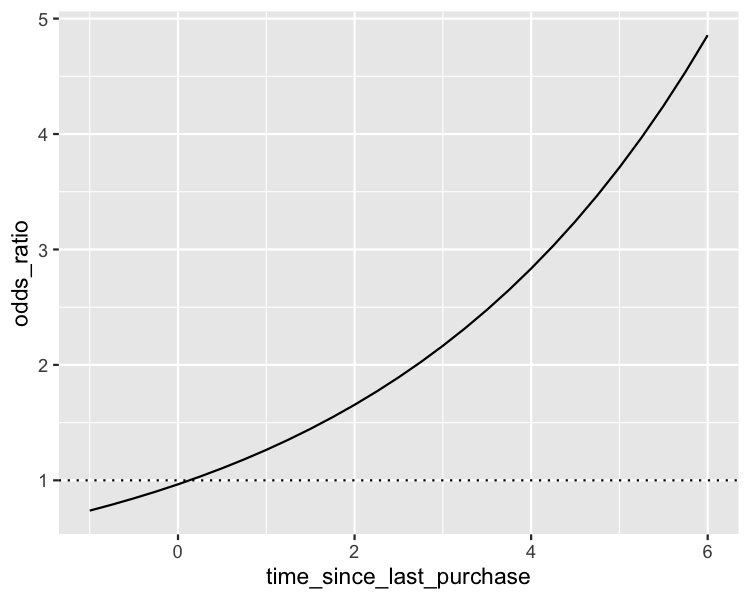
A line plot of odds ratio versus time since last purchase, with a line at odds ratio equals one. For low time since last purchase, the most likely outcome is not churning. The odds of churning increase as time since last purchase increases, up to five time the odds of not churning.

Nhập môn Hồi quy bằng R

Visualizing log odds ratio

ggplot(
  prediction_data, 
  aes(time_since_last_purchase, odds_ratio)
) +
  geom_line() +
  geom_hline(yintercept = 1, linetype = "dotted") +
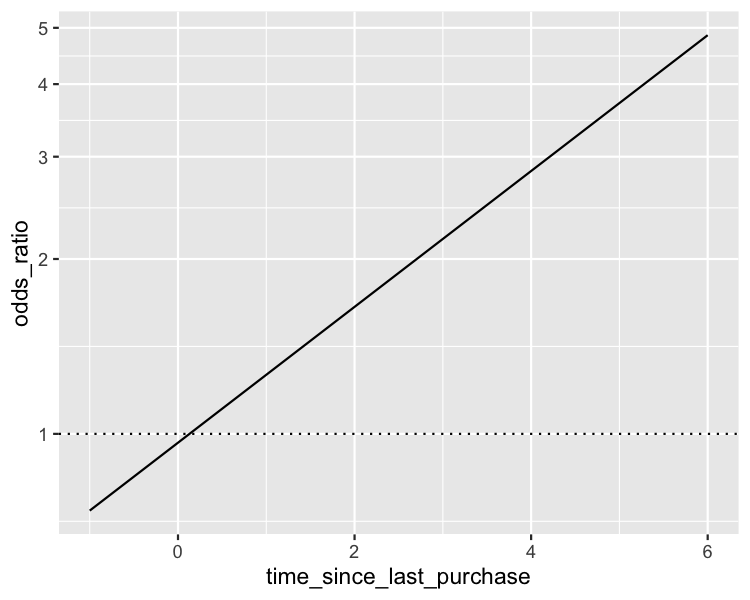
  scale_y_log10()

The line plot of odds ratio versus time since last purchase, with a line at odds ratio equals one. The y-axis uses a logarithmic scale, which has resulted in the odds ratio line becoming linear.

Nhập môn Hồi quy bằng R

Calculating log odds ratio

prediction_data <- explanatory_data %>%
  mutate(
    has_churned = predict(mdl_recency, explanatory_data, type = "response"),
    most_likely_response = round(has_churned),
    odds_ratio = has_churned / (1 - has_churned),
    log_odds_ratio = log(odds_ratio),
    log_odds_ratio2 = predict(mdl_recency, explanatory_data)
  )
Nhập môn Hồi quy bằng R

All predictions together

tm_snc_lst_prch has_churned most_lkly_rspns odds_ratio log_odds_ratio log_odds_ratio2
0 0.491 0 0.966 -0.035 -0.035
2 0.623 1 1.654 0.503 0.503
4 0.739 1 2.834 1.042 1.042
6 0.829 1 4.856 1.580 1.580
... ... ... ... ... ...
Nhập môn Hồi quy bằng R

Comparing scales

Scale Are values easy to interpret? Are changes easy to interpret? Is precise?
Probability
Most likely outcome ✔✔
Odds ratio
Log odds ratio
Nhập môn Hồi quy bằng R

Let's practice!

Nhập môn Hồi quy bằng R

Preparing Video For Download...