Seaborn bar plots

Làm việc với dữ liệu phân loại trong Python

Kasey Jones

Research Data Scientist

Traditional bar chart

# Code provided for clarity
reviews["Traveler type"].value_counts().plot.bar()
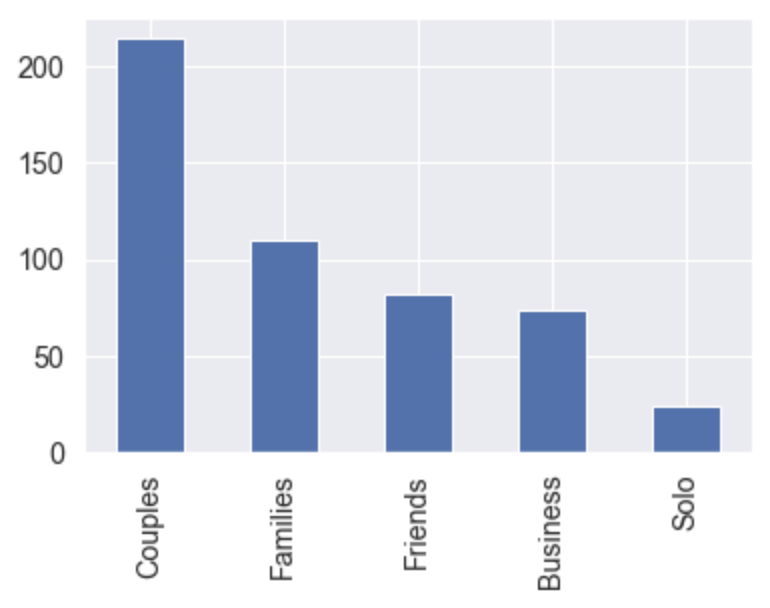
A bar chart counting the number of reviews by different traveler types.

Làm việc với dữ liệu phân loại trong Python

The syntax

sns.set(font_scale=1.3)
sns.set_style("darkgrid")

sns.catplot(x="Traveler type", y="Score", data=reviews, kind="bar")
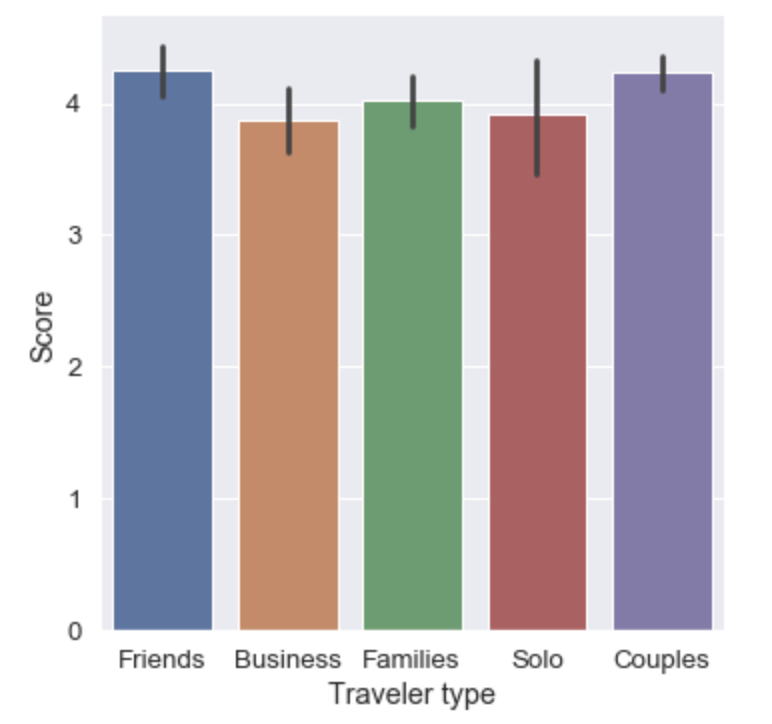
A seaborn categorical bar plot for hotel reviews given the reviewers traveler type.

Làm việc với dữ liệu phân loại trong Python

Ordering your categories

reviews["Traveler type"] = reviews["Traveler type"].astype("category")
reviews["Traveler type"].cat.categories
Index(['Business', 'Couples', 'Families', 'Friends', 'Solo'], dtype='object')
Làm việc với dữ liệu phân loại trong Python

Updated visualization

sns.catplot(x="Traveler type", y="Score", data=reviews, kind="bar")
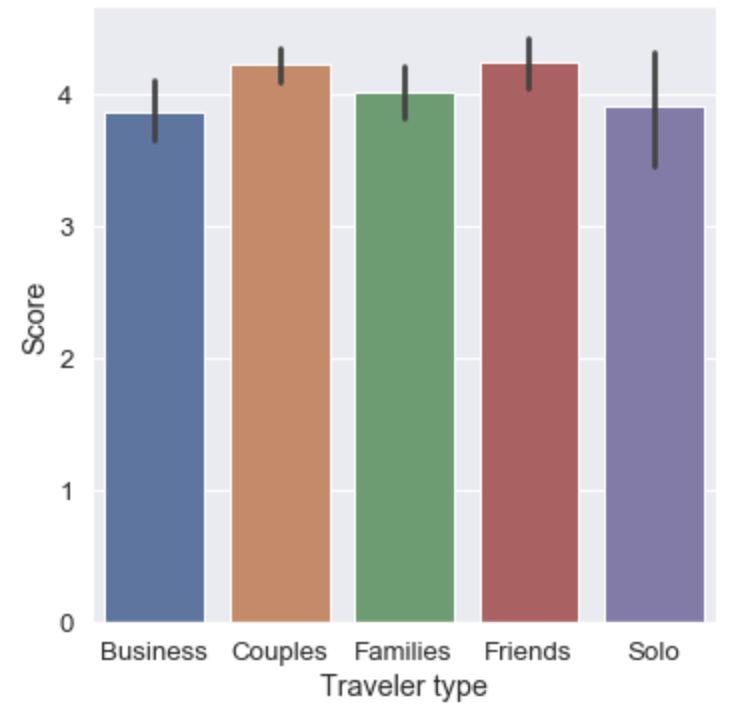
  • Note: catplot() has an order parameter
Làm việc với dữ liệu phân loại trong Python

The hue parameter

  • hue:
    • name of a variable in data
    • used to split the data by a second category
    • also used to color the graphic
sns.set(font_scale=1.2)
sns.set_style("darkgrid")
sns.catplot(x="Traveler type", y="Score", data=reviews, kind="bar",
            hue="Tennis court")  # <--- new parameter
Làm việc với dữ liệu phân loại trong Python

Bar plot across two variables

Làm việc với dữ liệu phân loại trong Python

Bar plot practice

Làm việc với dữ liệu phân loại trong Python

Preparing Video For Download...