Point and count plots

Làm việc với dữ liệu phân loại trong Python

Kasey Jones

Research Data Scientist

Point plot example

sns.catplot(x="Pool", y="Score", data=reviews, kind="point") # <--- updated
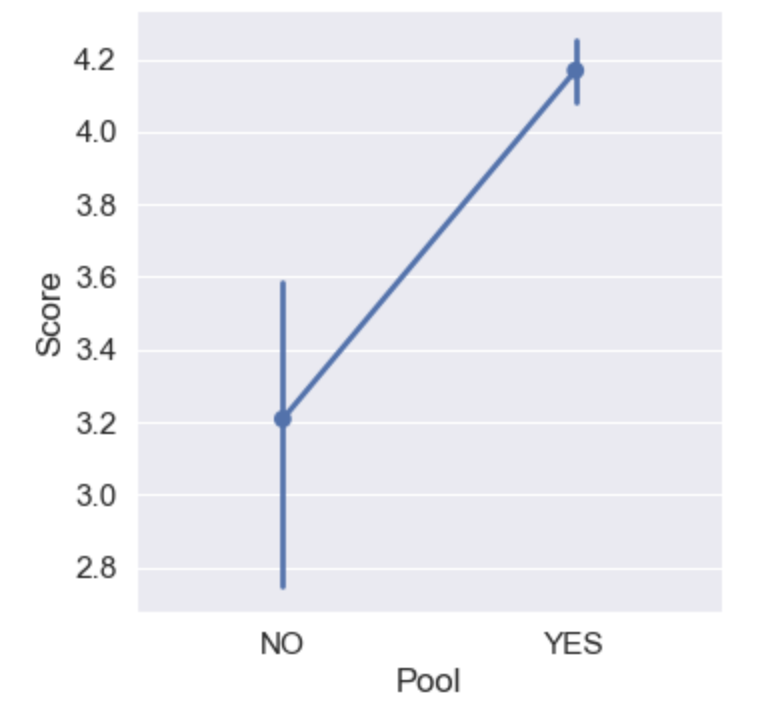
A point plot created using the seaborn library that shows the mean of reviewers scores given whether the hotel has a pool or not.

Làm việc với dữ liệu phân loại trong Python

Bar plot vs. point plot

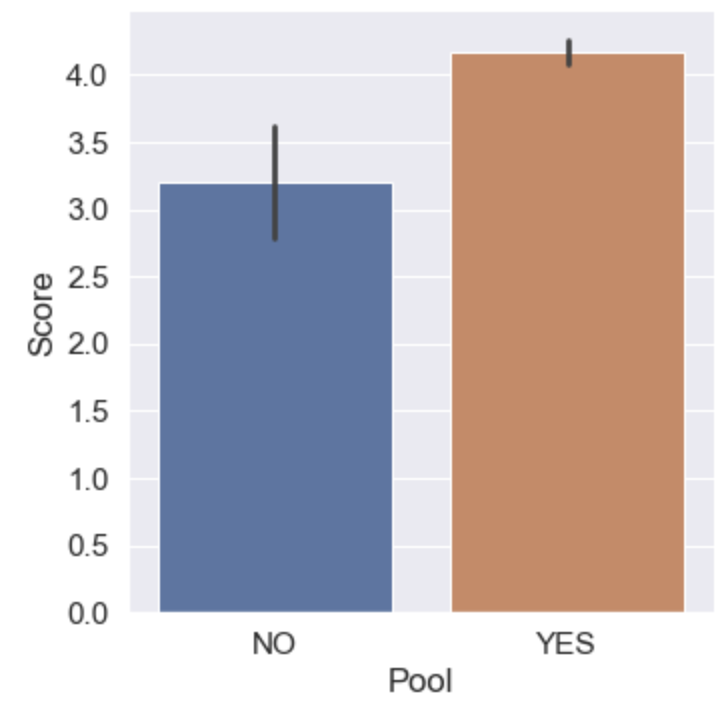
Bar plot A bar plot created using the seaborn library that shows central tendency of reviewers scores given whether the hotel has a pool or not.

Point plot A point plot created using the seaborn library that shows central tendency of reviewers scores given whether the hotel has a pool or not.

Làm việc với dữ liệu phân loại trong Python

Point plot with hue

sns.catplot(x="Spa", y="Score", data=reviews, kind="point",
            hue="Tennis court", dodge=True  # < --- New Parameter!
)
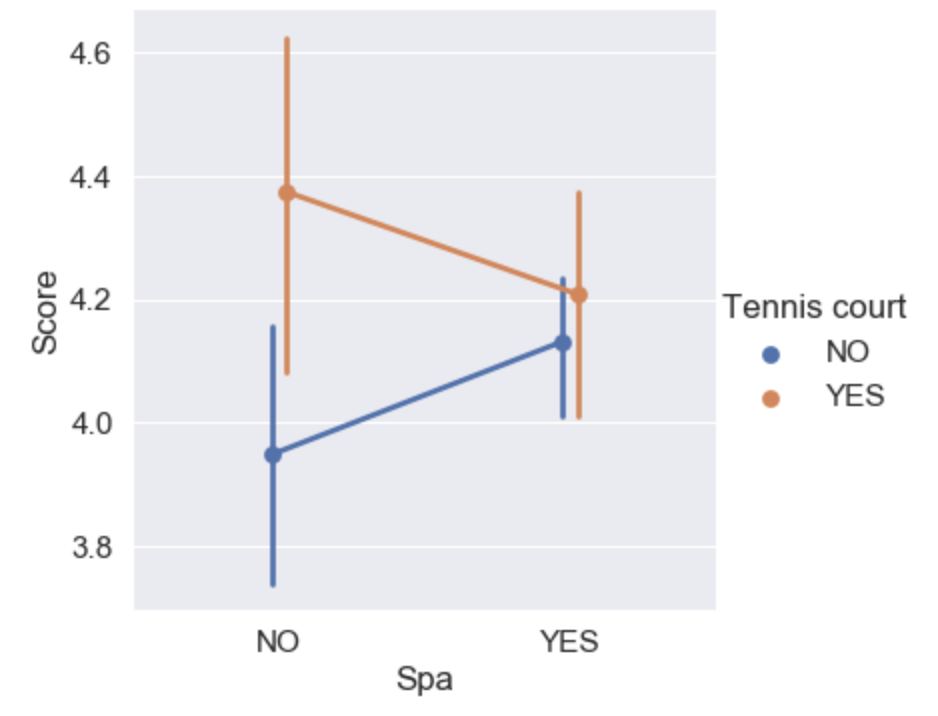
A point plot created using the seaborn library that shows central tendency of reviewers scores across the Spa and Tennis court parameters. This visual uses both the hue and dodge parameters.

Làm việc với dữ liệu phân loại trong Python

Using the join parameter

sns.catplot(x="Score",
            y="Review weekday",
            data=reviews,
            kind="point", 
            join=False # < --- New!
)

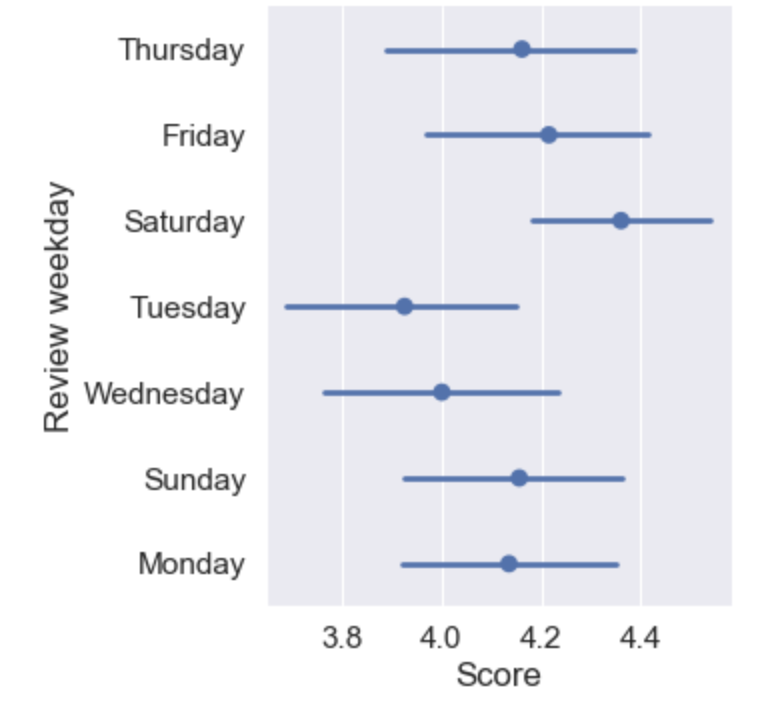
A point plot created using the seaborn library that shows how the join parameter effects the output.

Làm việc với dữ liệu phân loại trong Python

One last catplot type

sns.catplot(x="Tennis court", data=reviews, kind="count", hue="Spa")
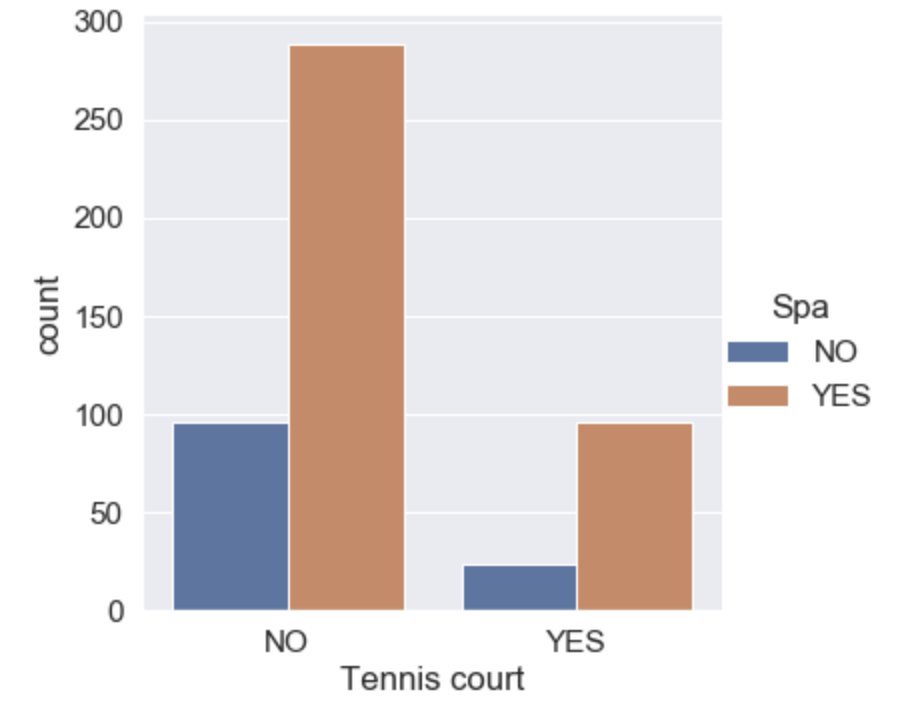
A graphic showing a seaborn count plot in action. This plot is counting the occurrences of reviews for hotels with tennis courts, a spa, both, or none.

Làm việc với dữ liệu phân loại trong Python

Time to practice!

Làm việc với dữ liệu phân loại trong Python

Preparing Video For Download...